Agenda
- Create Data Operation
- Create Data Product
- Create Transformation Script
- Create Data Transformation
- See Data Analysis
- See Data Array
- Plot Data
This tutorial shows an example of Machine Learning with Wendelin.
Based on data from previous tutorials we will predict air pressure from humidity using Linear Regression by scikit-learn and visualize results.
Before doing this tutorial make sure you read and completed the following tutorials
Data Operation
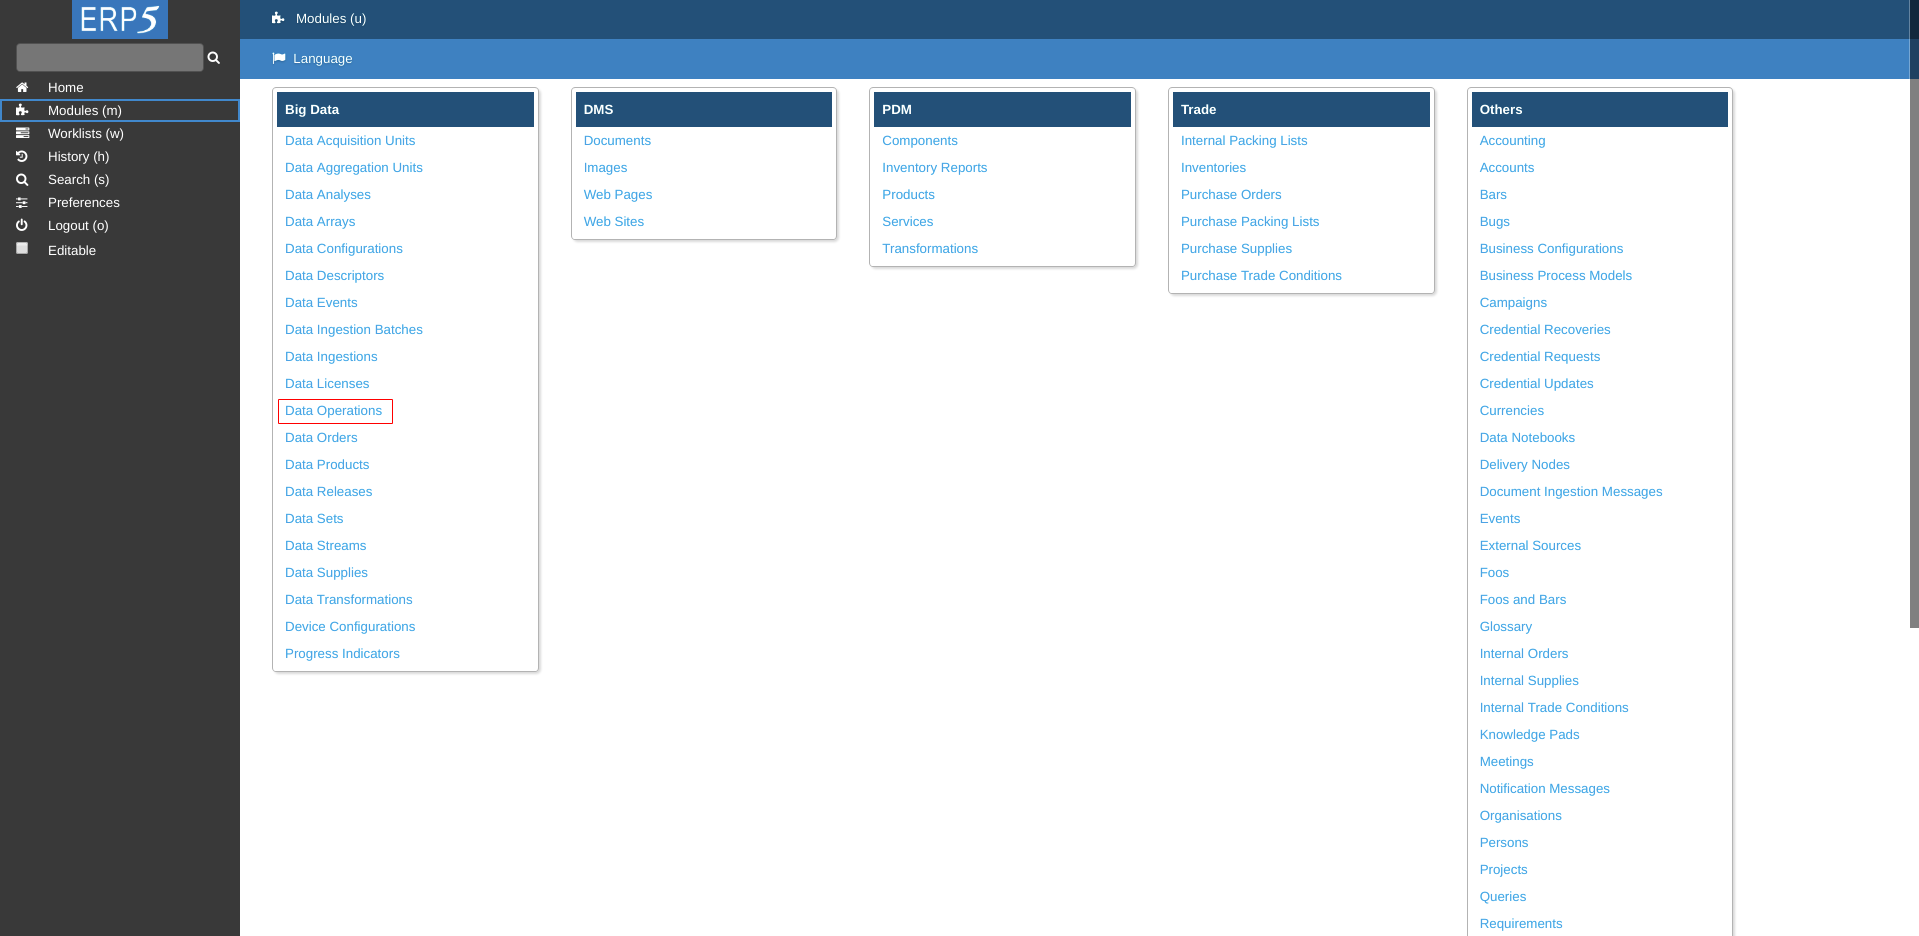
Open your Wendelin dashboard.
In Modules click on Data Operations Module
Add Data Operation
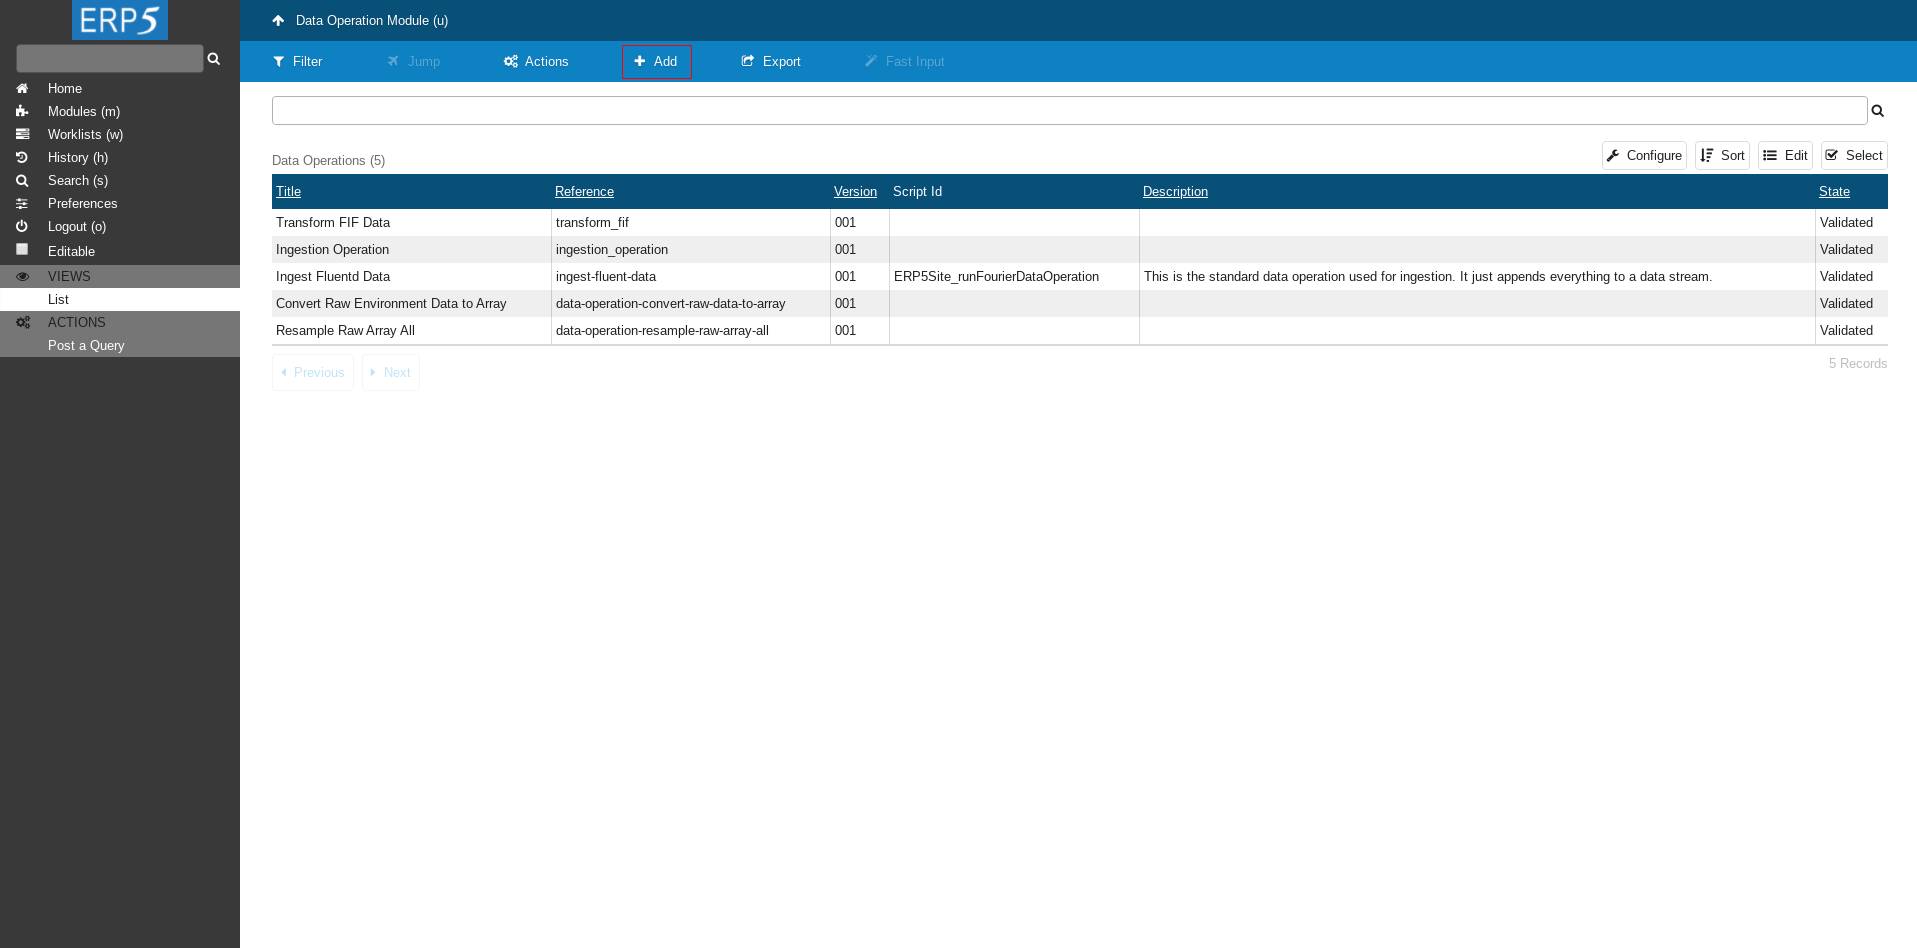
Click on Add to add a new Data Operation.
Add Data Operation
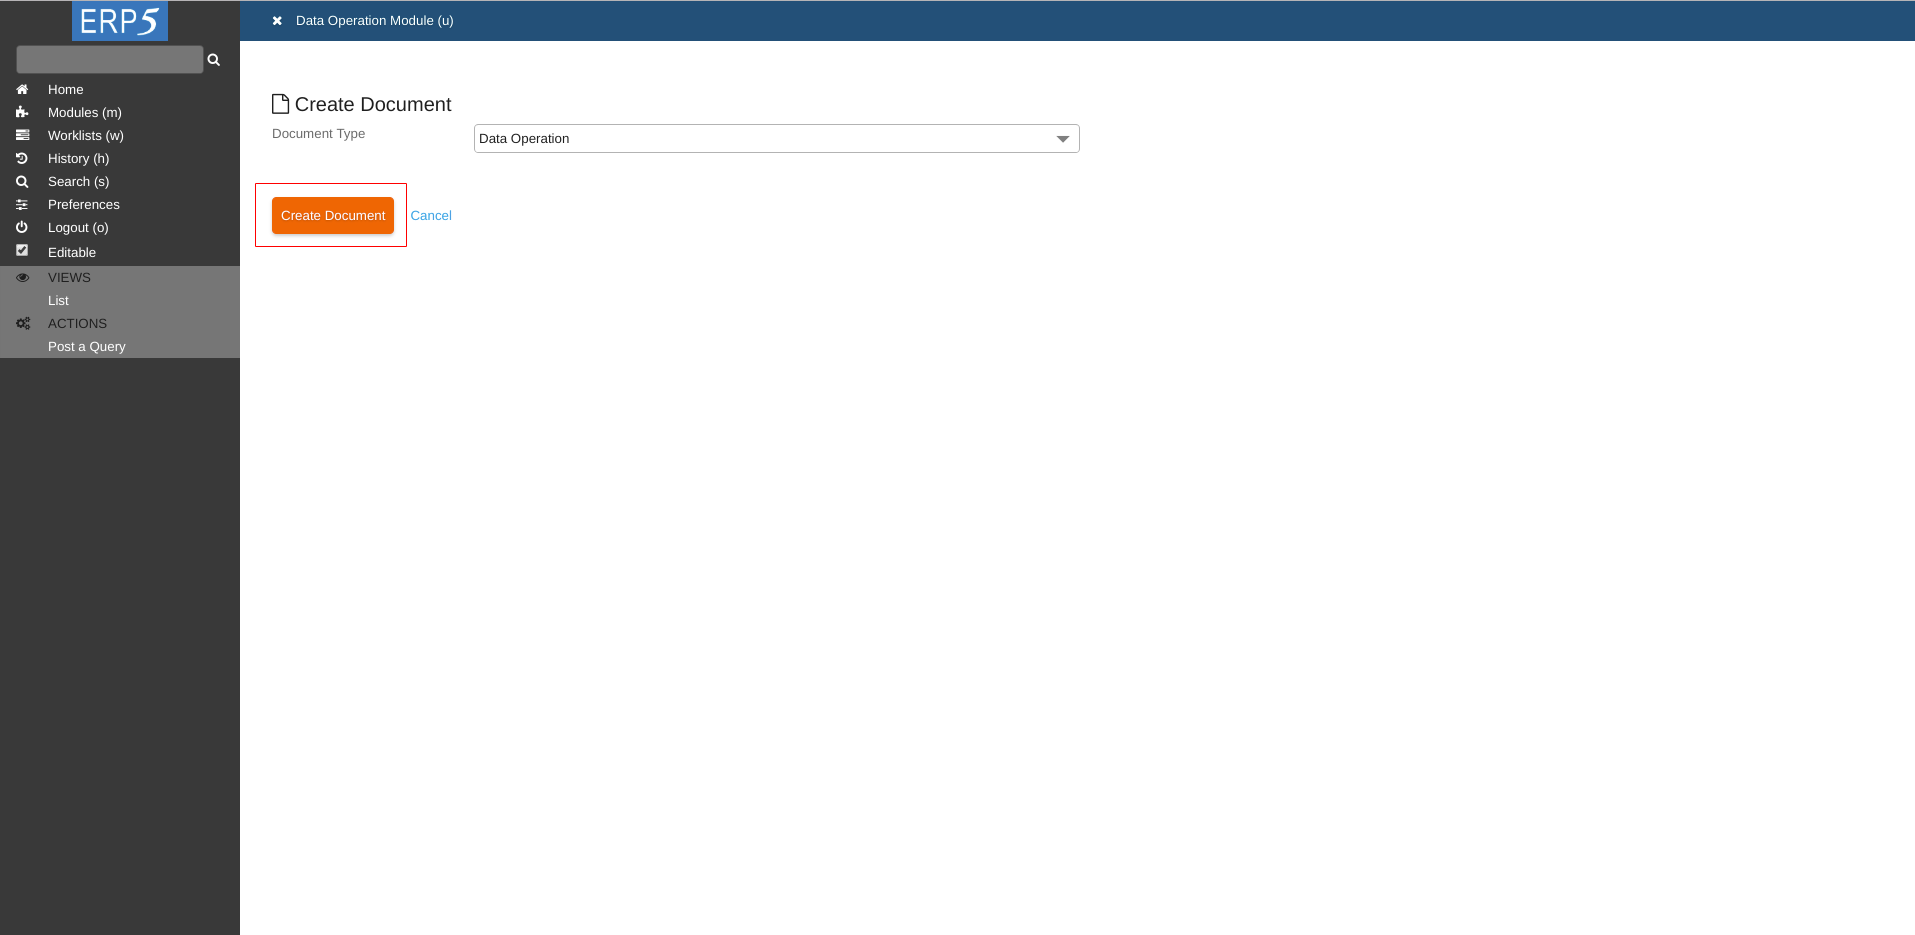
Click Proceed to continue.
Fill the Form

Fill the form to create Data Operation.
Title - we name it Predict Pressure
Reference - data-operation-predict-pressure
Script ID - DataAnalysisLine_predictPressureFromHumidity: this script will do all the magic. It doesn't exist yet, we will create it later in this tutorial.
At the don't forget to Save the changes.
Validate

Click on Validate on left side panel to validate Data Operation.
Confirm Validation
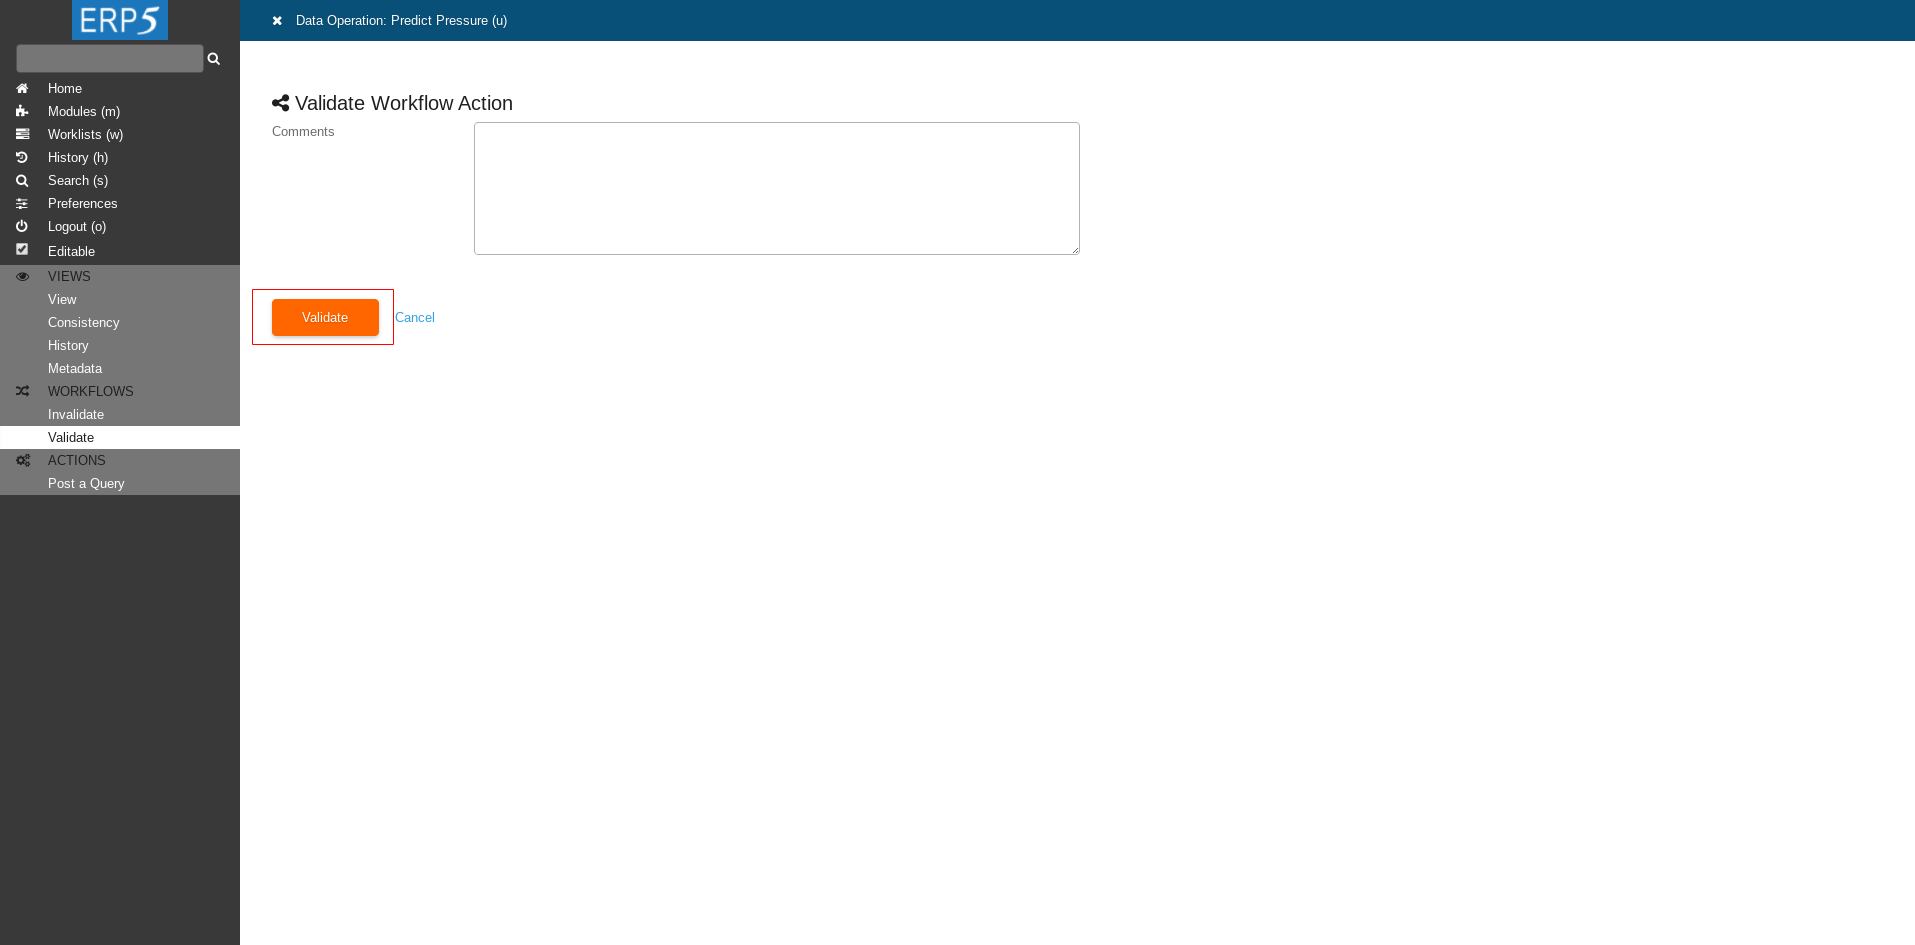
Click Validate to confirm validation.
Data Product
Now we need to create a new Data Product which will the output Data Product of the Transformation.
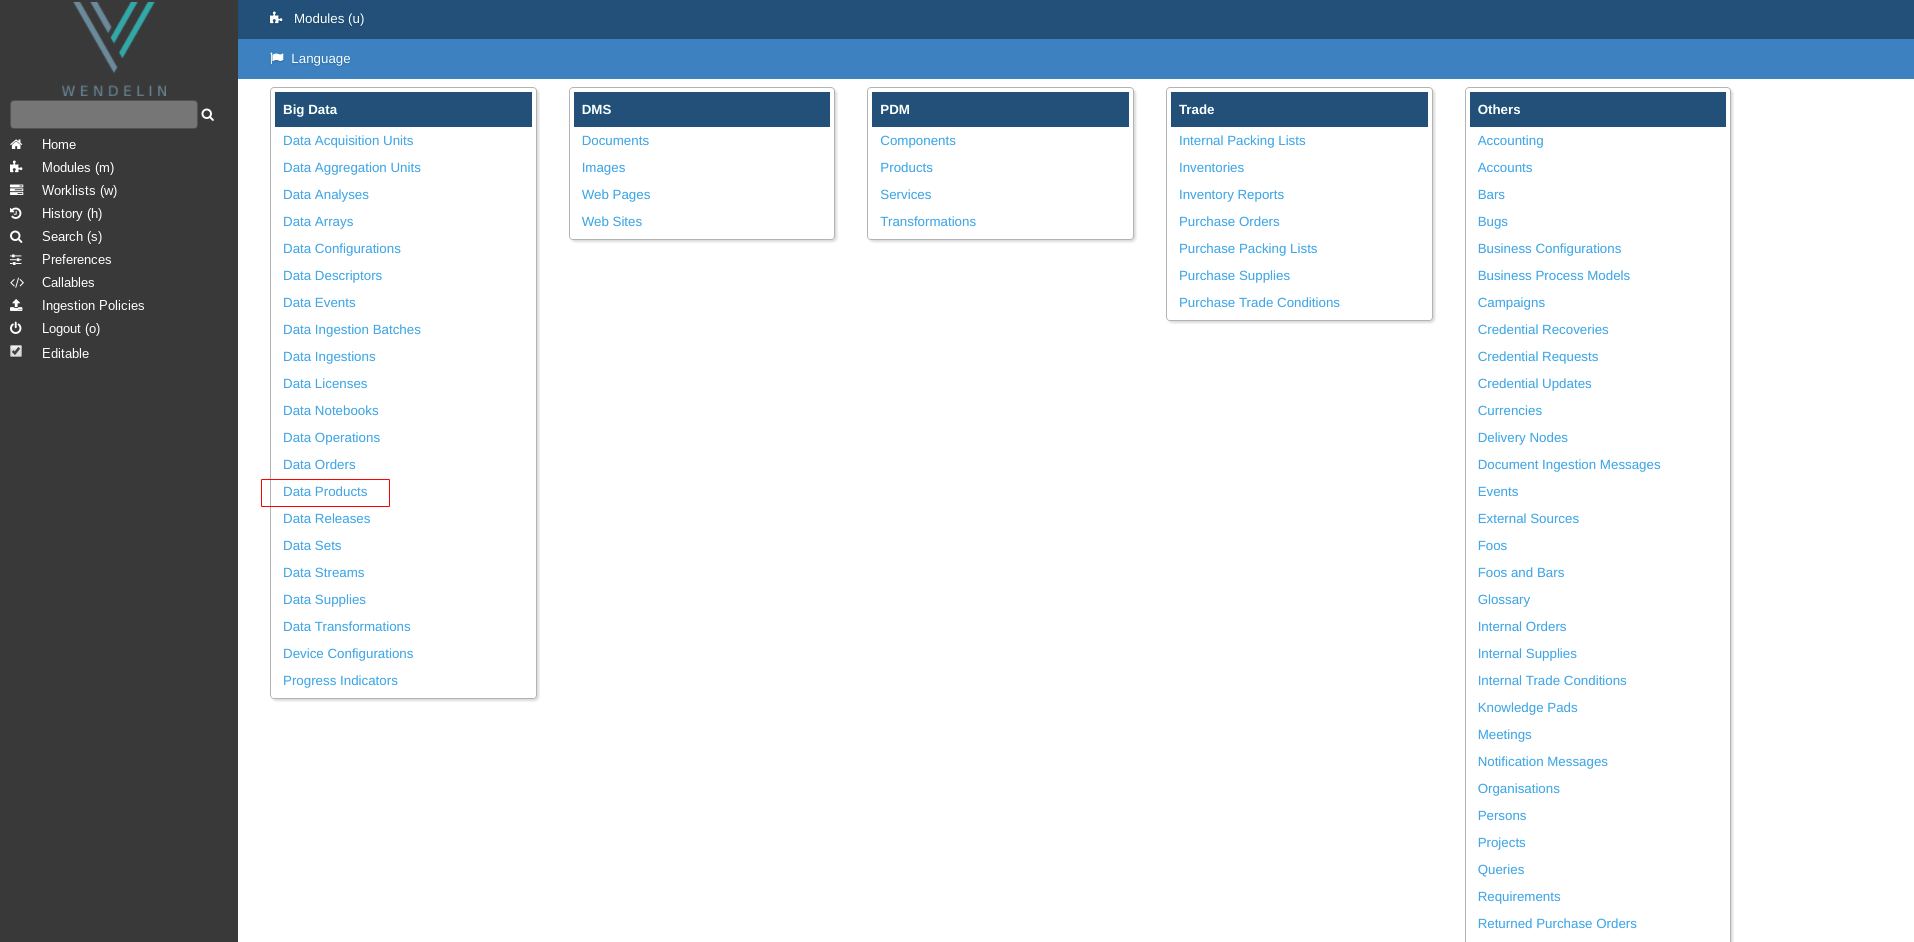
Create Data Product
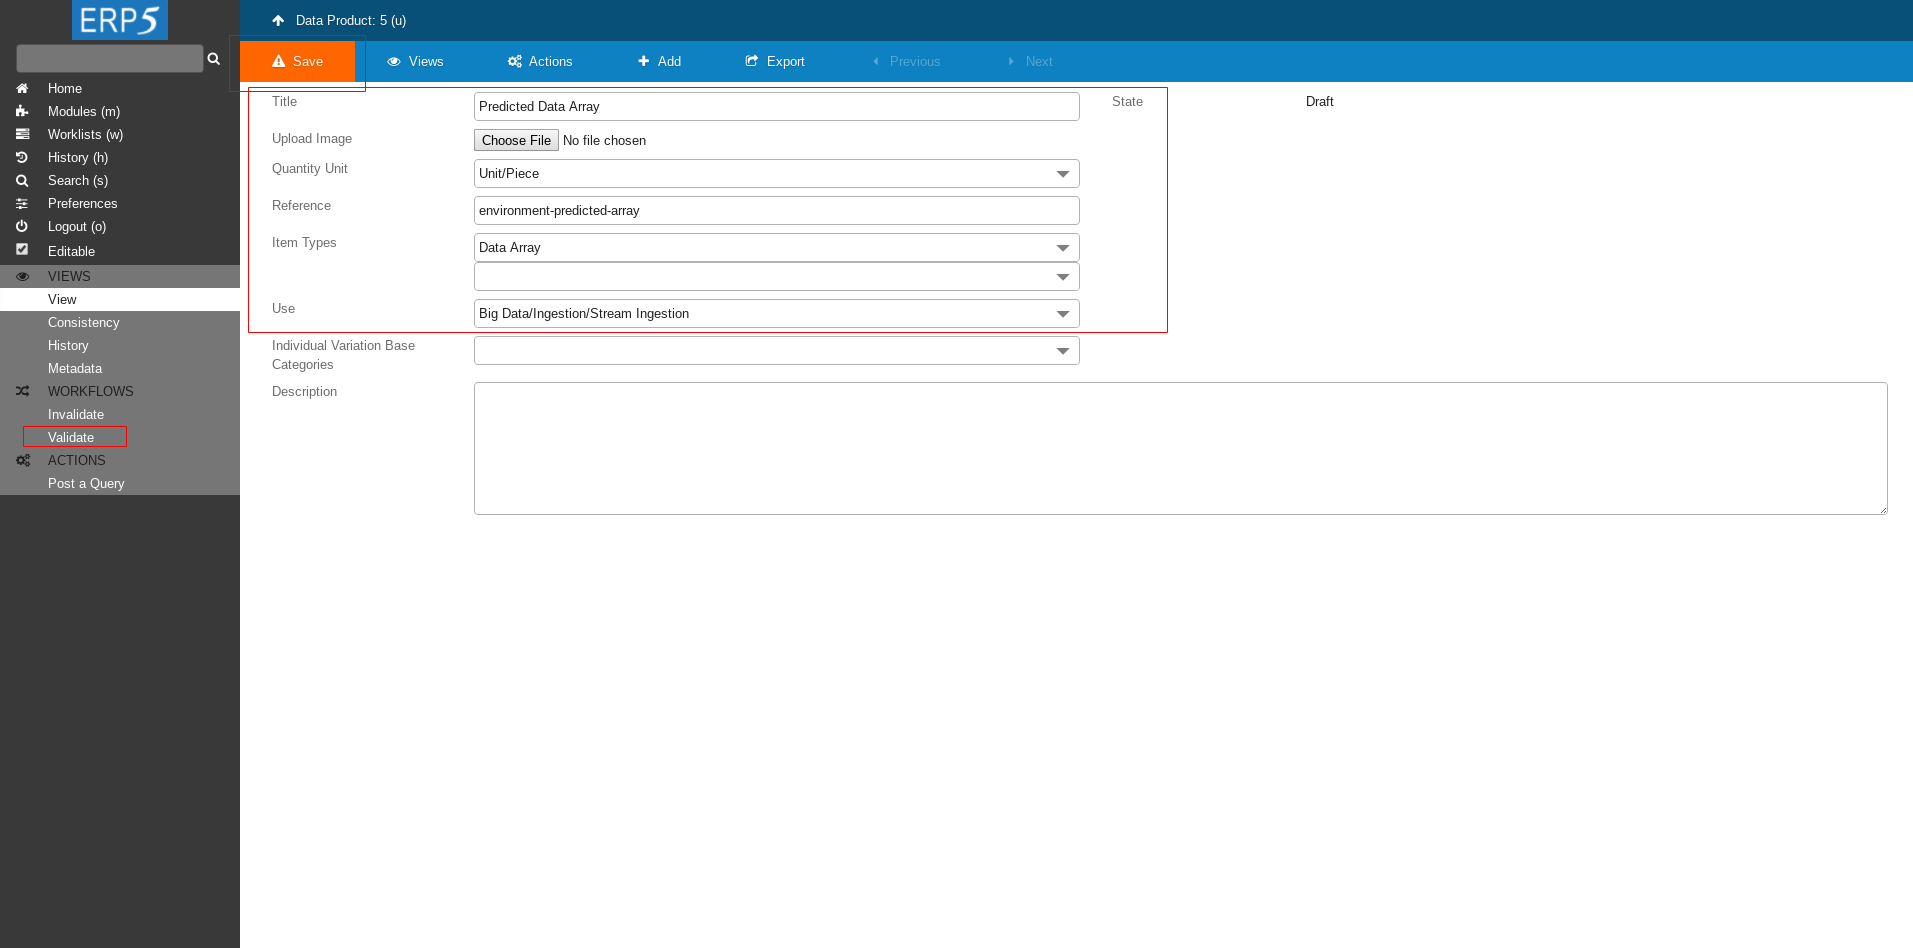
Create a new Data Product as described in HowTo Create Data Product tutorial with following values
Title - Predicted Data Array
Quantity Unit - Unit/Piece
Reference - environment-predicted-array
Item Types
Use
- Big Data/Ingestion/Stream Ingestion
At the end don't forget to save the changes and Validate.
Portal Callables
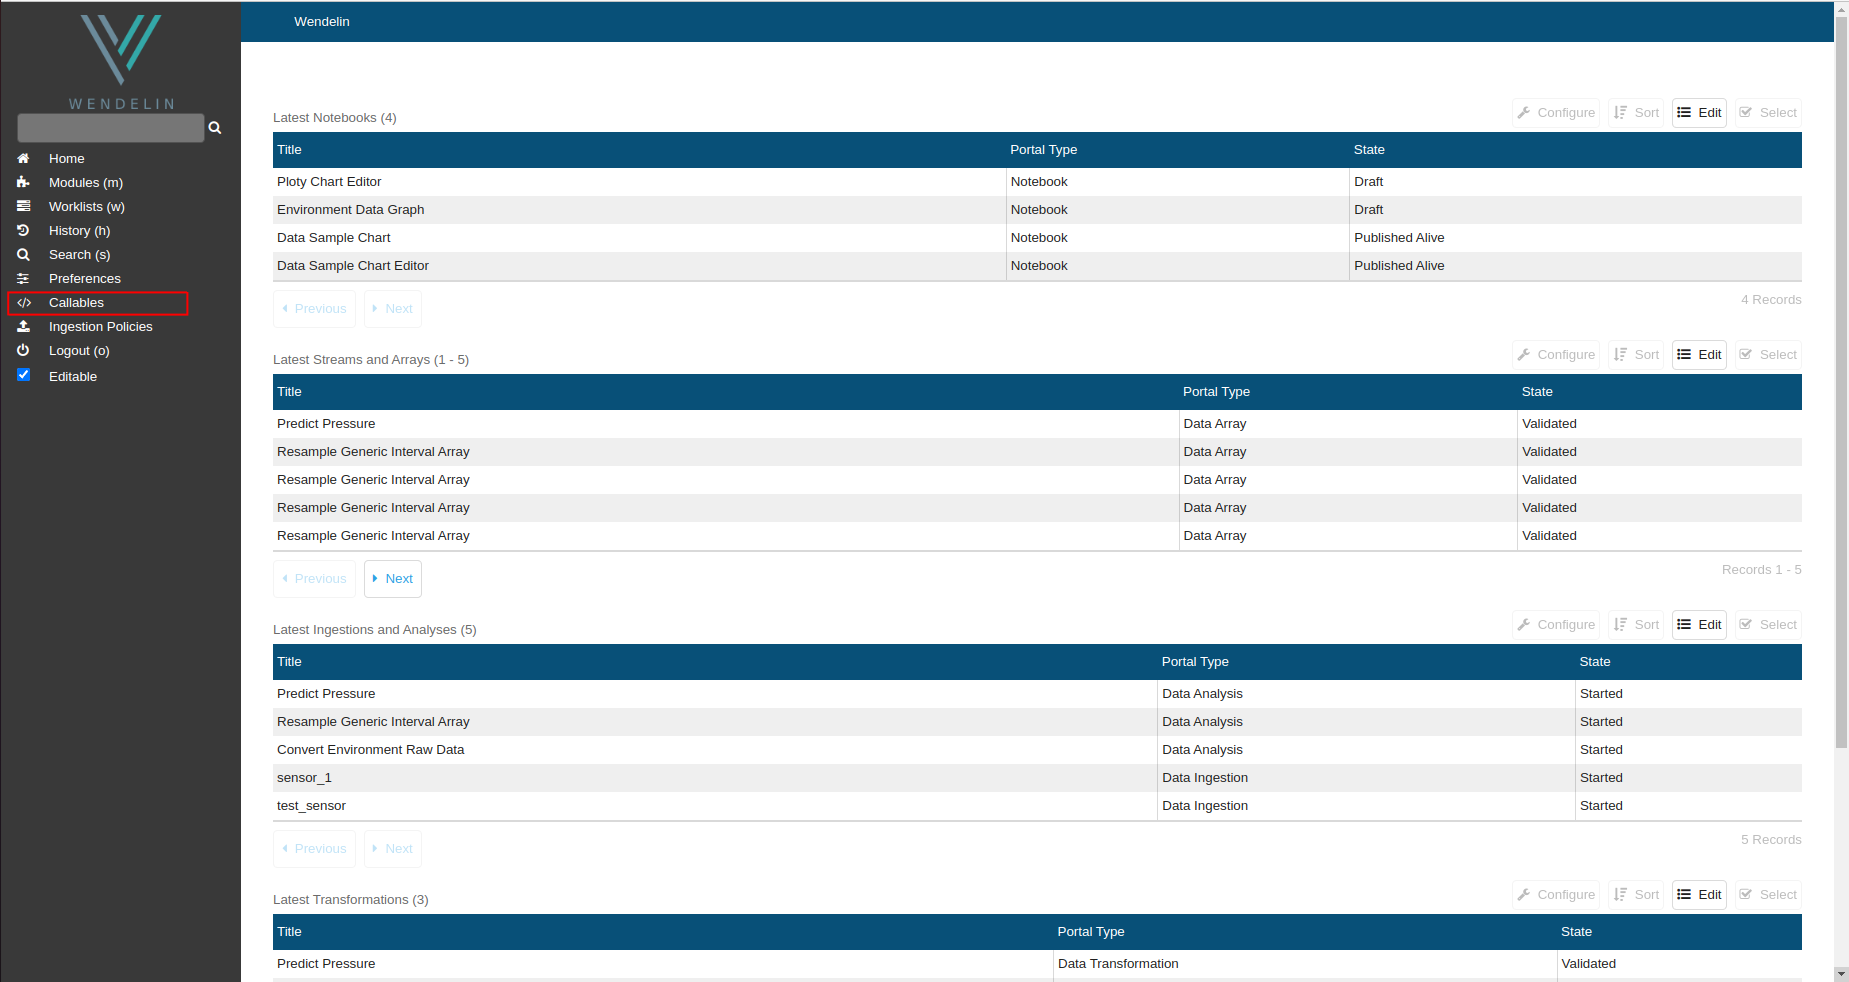
After Data Product is created and validated, navigate to page called Portal Callables by clicking on Callable on the left side panel.
Portal Callables Cont.
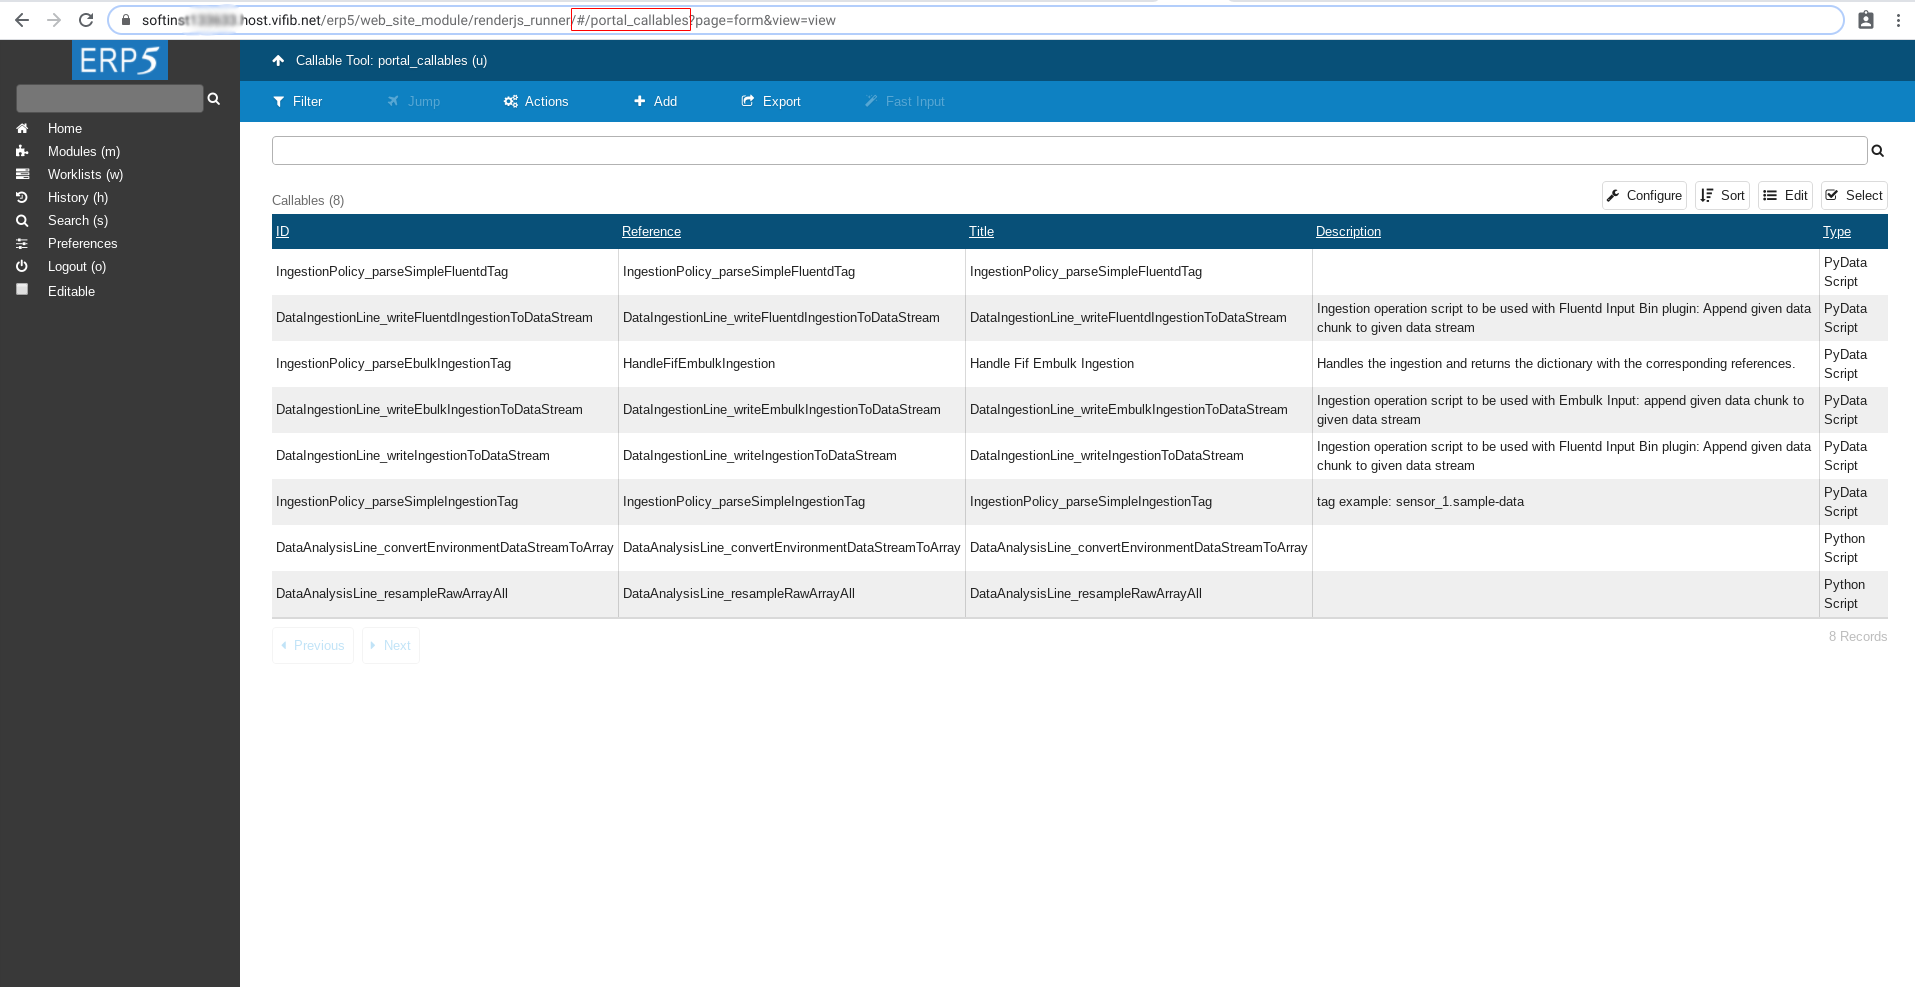
Here we will create and store the prediction script.
Add Transformation Script
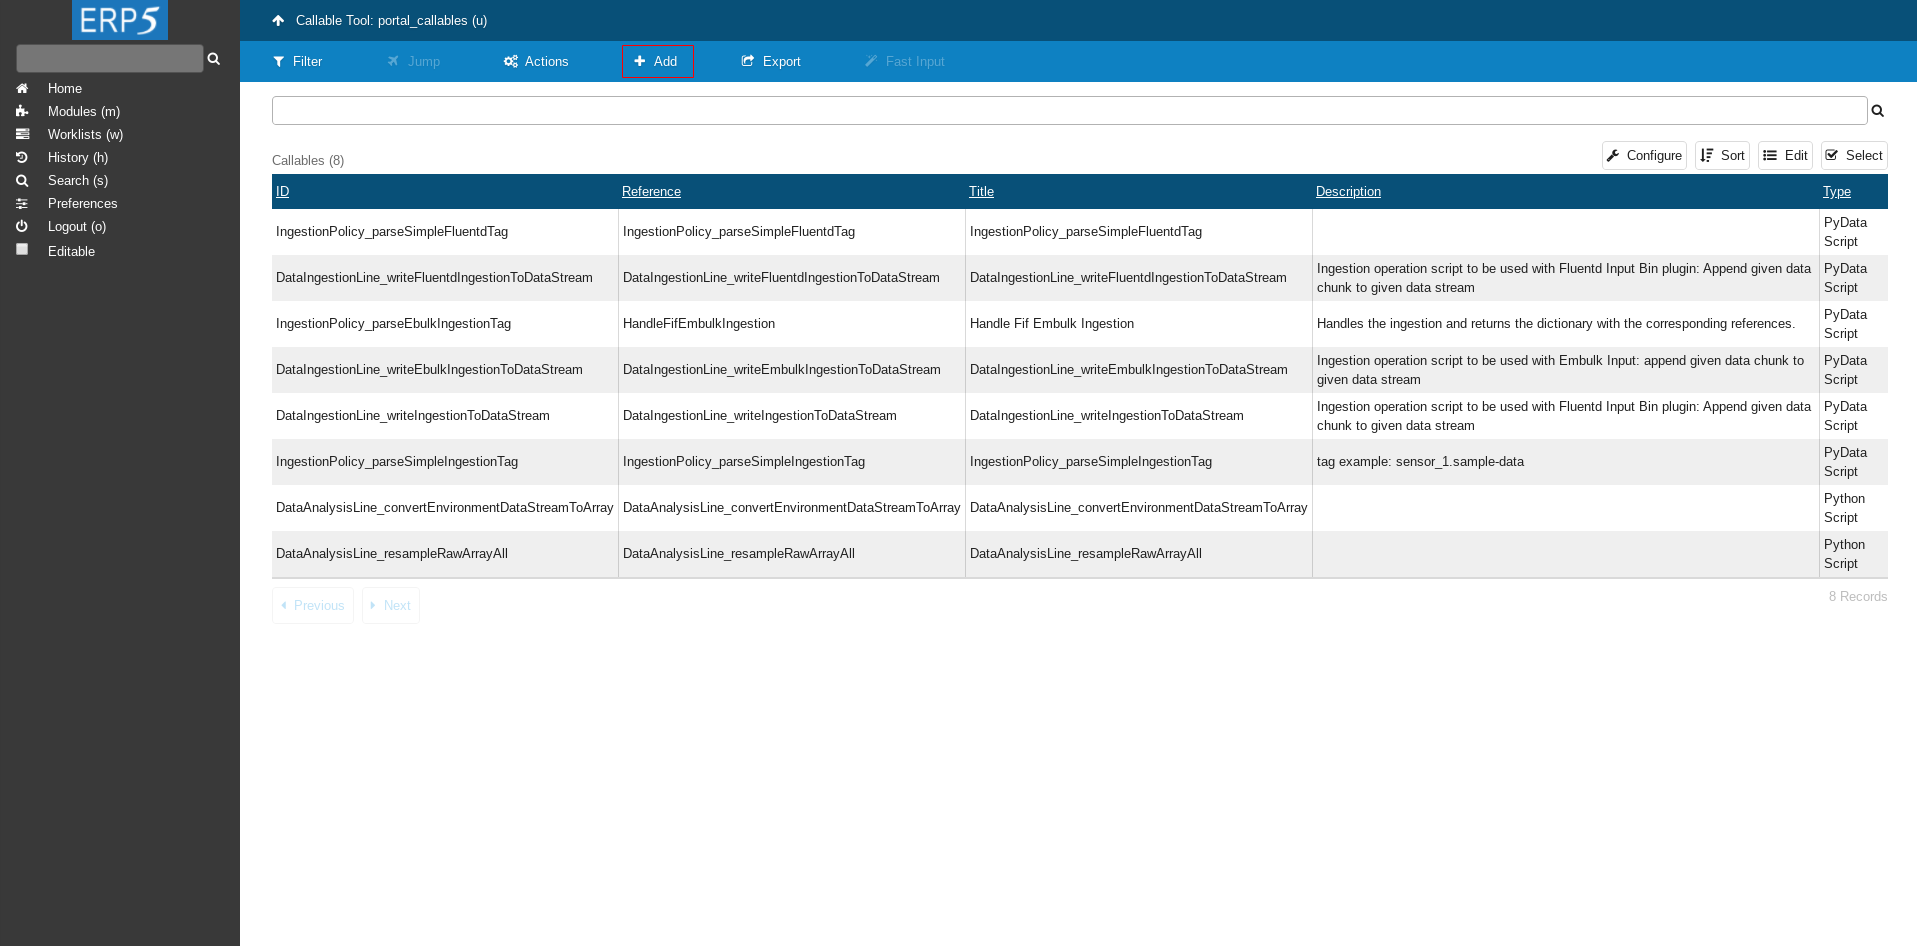
Click on Add button to add a new script.
Add Transformation Script Cont.
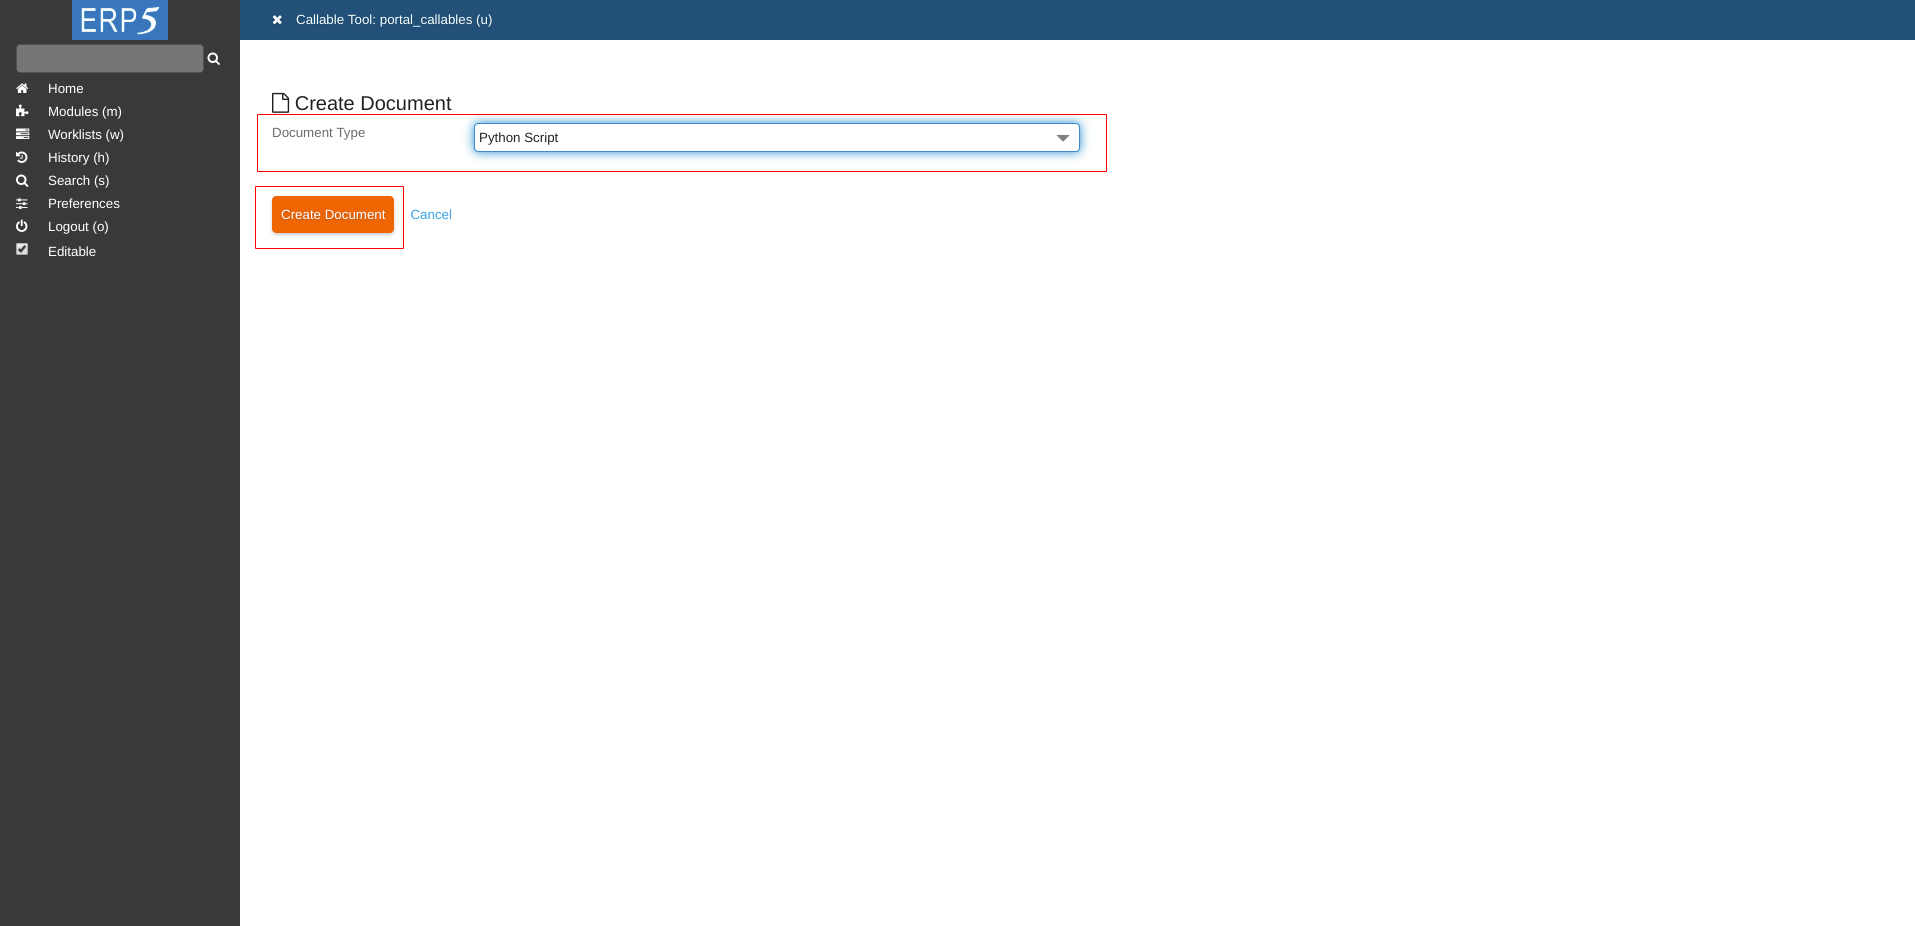
Choose Python Script as Document Type and click on Create Document to create an empty python script.
Fill The Form
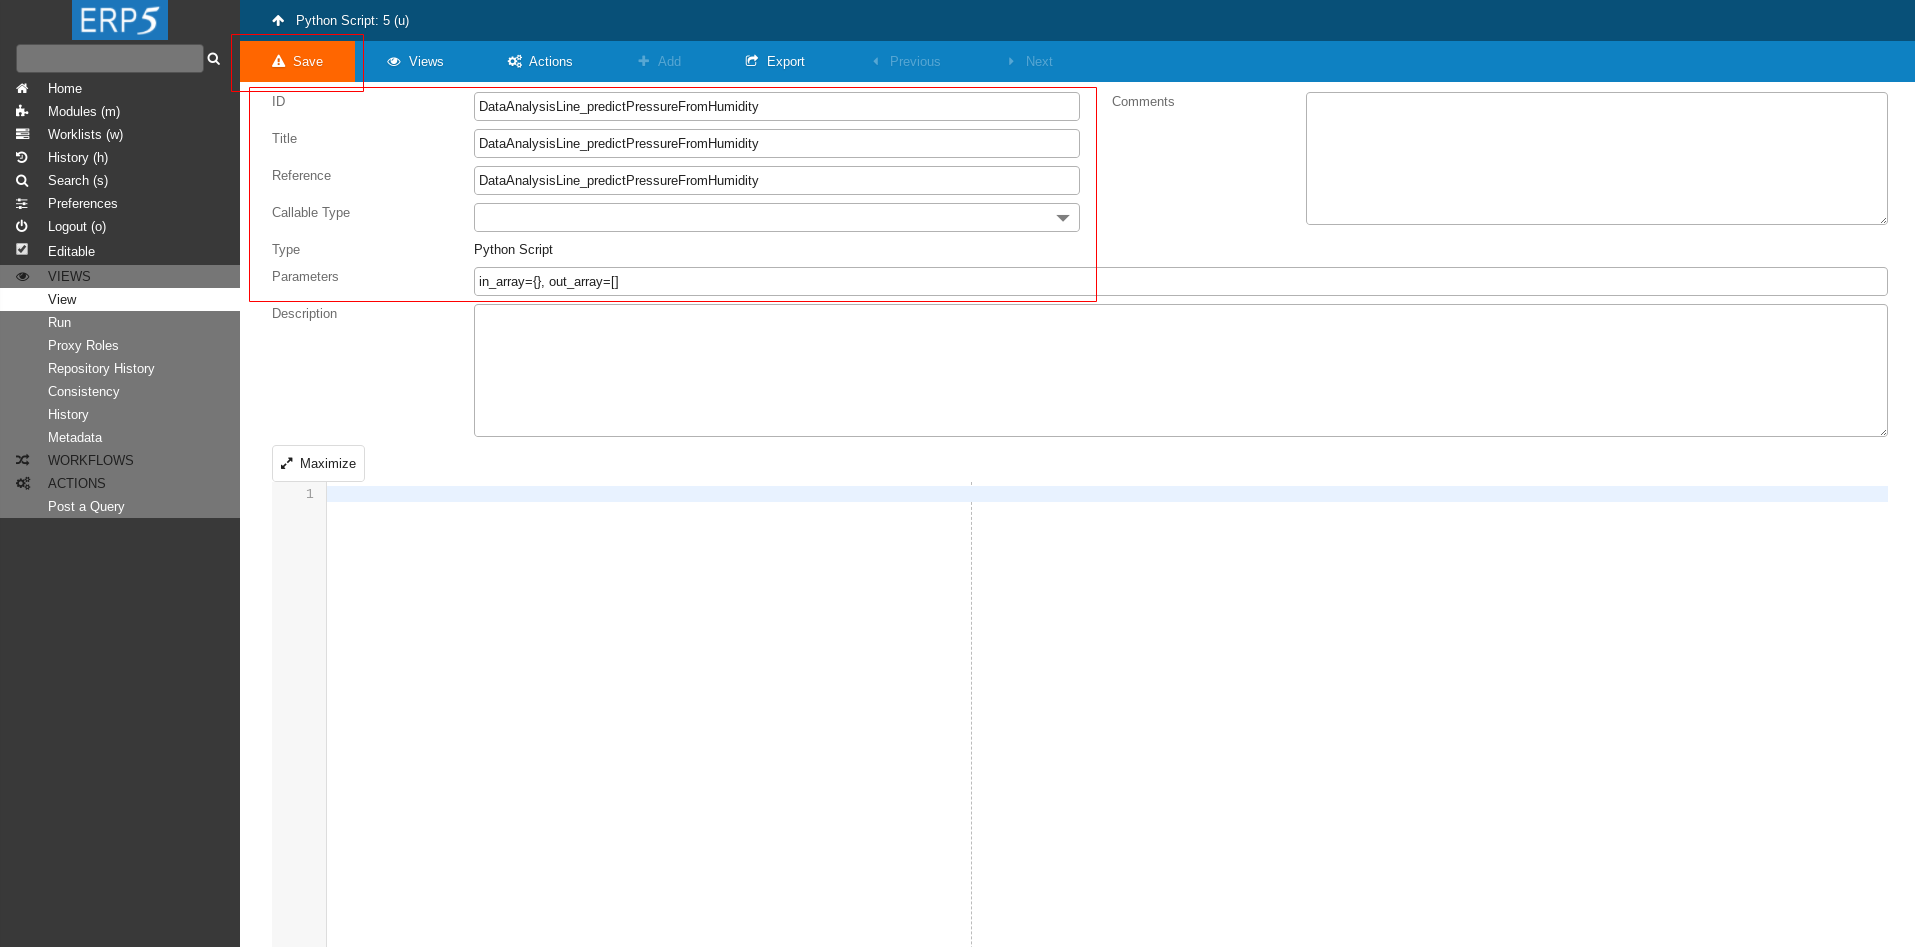
Define ID, Title and Reference of your script.
We name it DataAnalysisLine_predictPressureFromHumidity as we did in Data Operation at the beginning of this tutorial.
Next we define the parameters we will give to our script.
in_array - the input dictionary that contains Data Array where raw data is stored after the previous transformation.
out_array - the output Data Array where results of the prediction will be stored.
At the end click Save to save the changes.
Transformation Script
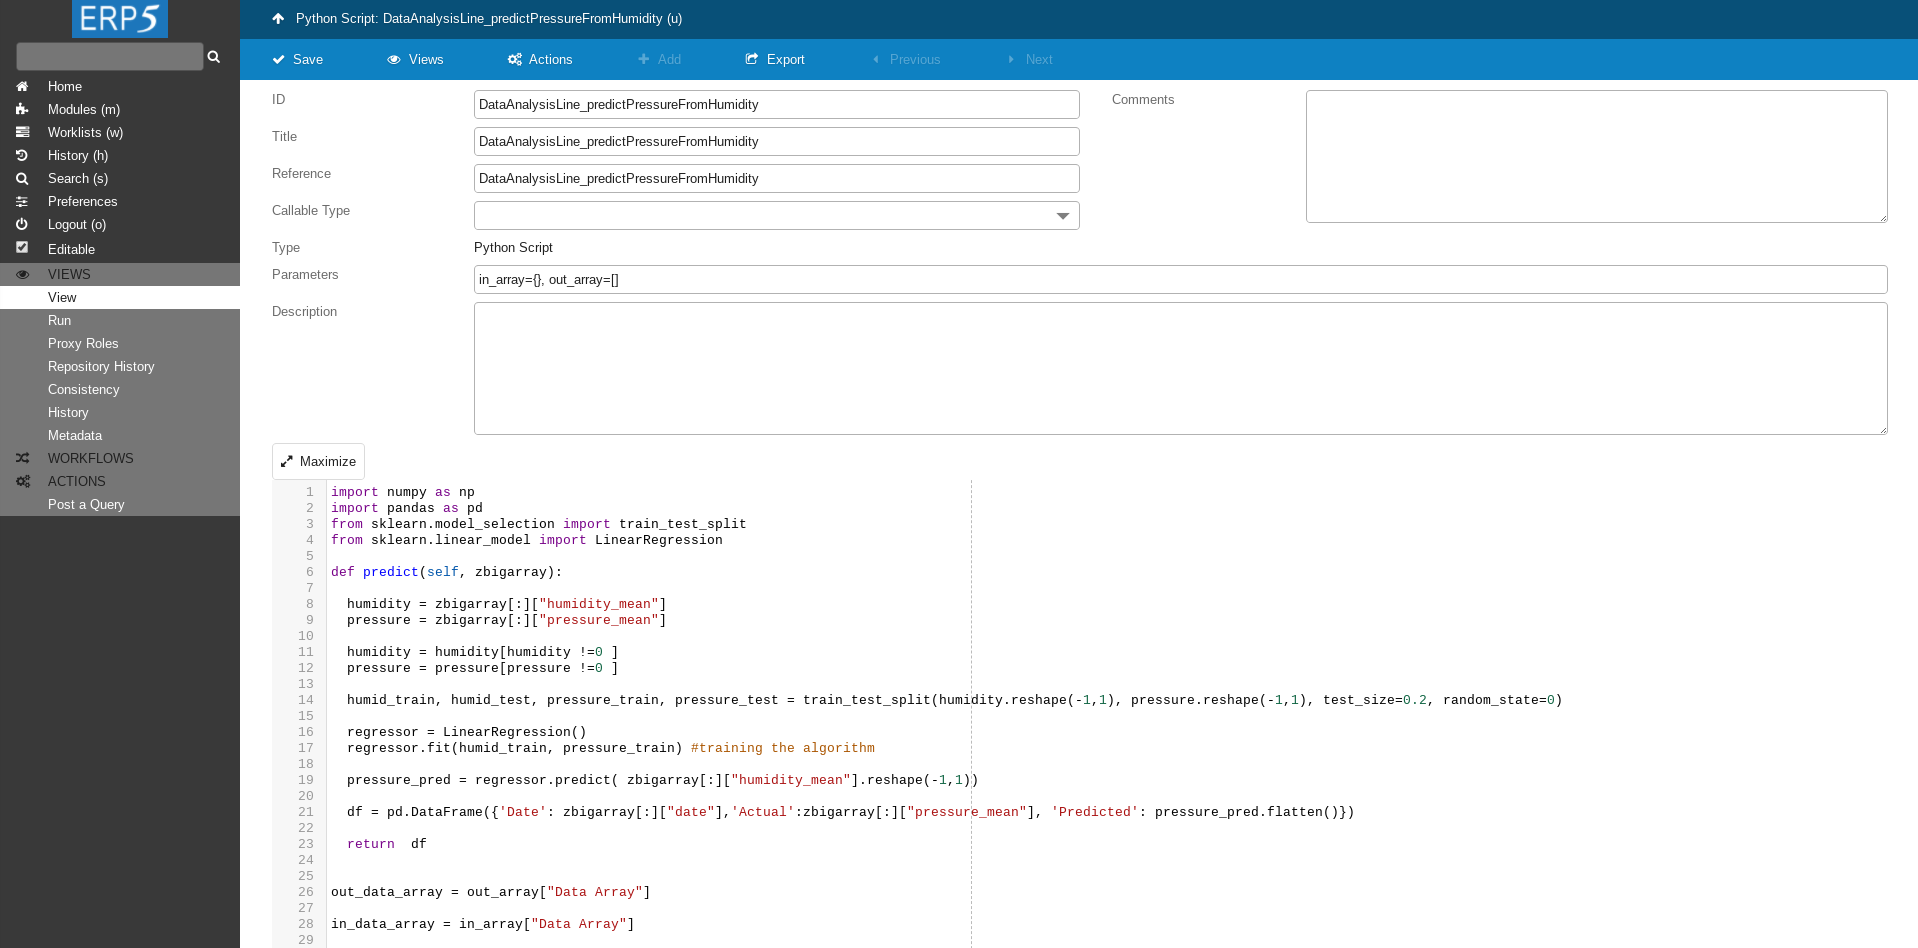
The script we write in the textbox area at the bottom of the page.
Transformation Script Cont.
import numpy as np
import pandas as pd
from sklearn.model_selection import train_test_split
from sklearn.linear_model import LinearRegression

def predict(zbigarray):

  humidity = zbigarray[:]["humidity_mean"]
  pressure = zbigarray[:]["pressure_mean"]

  humidity = humidity[humidity !=0 ]
  pressure = pressure[pressure !=0 ]

  humid_train, humid_test, pressure_train, pressure_test = train_test_split(humidity.reshape(-1,1), pressure.reshape(-1,1), test_size=0.2, random_state=0)

  regressor = LinearRegression()
  regressor.fit(humid_train, pressure_train) #training the algorithm

  pressure_pred = regressor.predict( zbigarray[:]["humidity_mean"].reshape(-1,1))

  df = pd.DataFrame({'Date': zbigarray[:]["date"],'Actual':zbigarray[:]["pressure_mean"], 'Predicted': pressure_pred.flatten()})

  return  df


out_data_array = out_array["Data Array"]

in_data_array = in_array["Data Array"]

in_zbigarray = in_data_array.getArray()
if in_zbigarray is None:
  return

if in_zbigarray.shape[0] == 0:
  return


df = predict(in_zbigarray)

ndarray = df.to_records(convert_datetime64=False)
dtype = [('Date', '<M8[ns]'),('Actual', '<f8'), ('Predicted', '<f8')]

zbigarray = out_data_array.getArray()
if zbigarray is None:
  zbigarray = out_data_array.initArray(shape=(0,), dtype=dtype)
  zbigarray.append(ndarray)
else:
  start_index = len(zbigarray)
  array_len =  len(ndarray)
  if start_index < array_len:
    zbigarray.append(ndarray[start_index:])
This script takes as an input data from resampled Data Array, splits data into training and tests set.
Then it learns on training set and predicts air pressure based on humidity.
In output array it stored the true and predicted values.
Don't forget to save the changes after editing the script.
Data Transformations
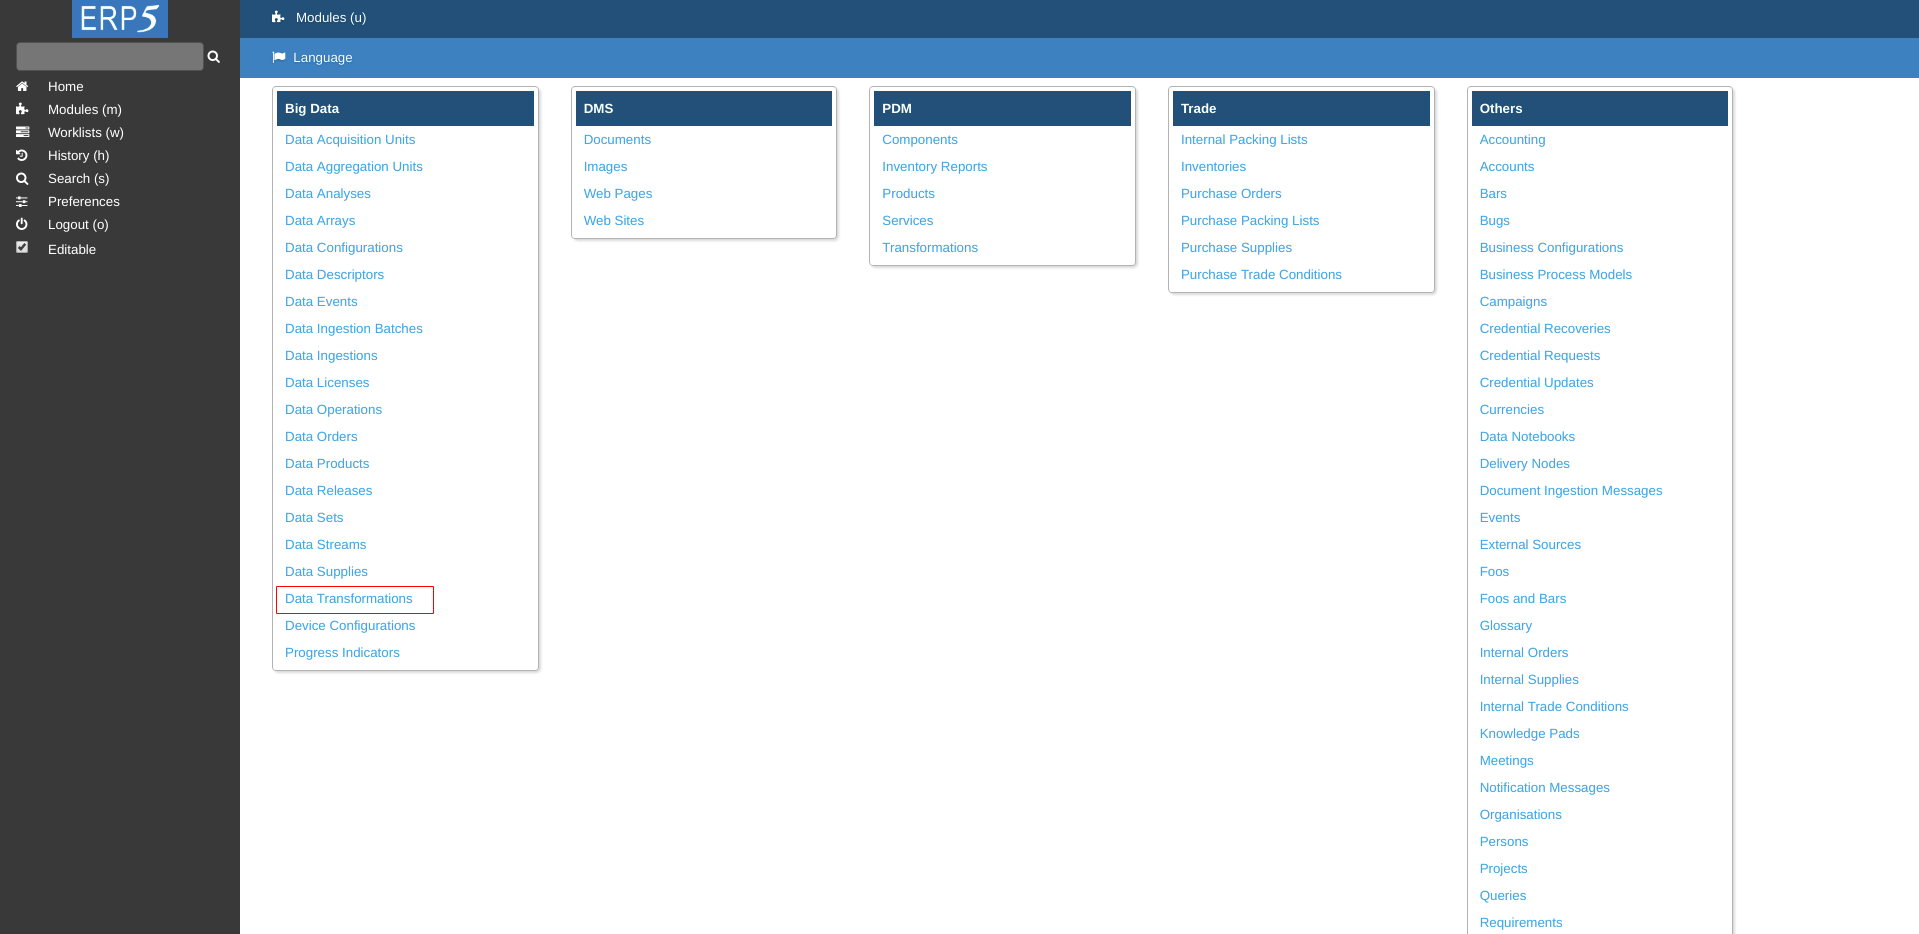
After your transformation script is ready, it's time to create Data Transformation.
On Modules page click on Data Transformations.
Add Data Transformation
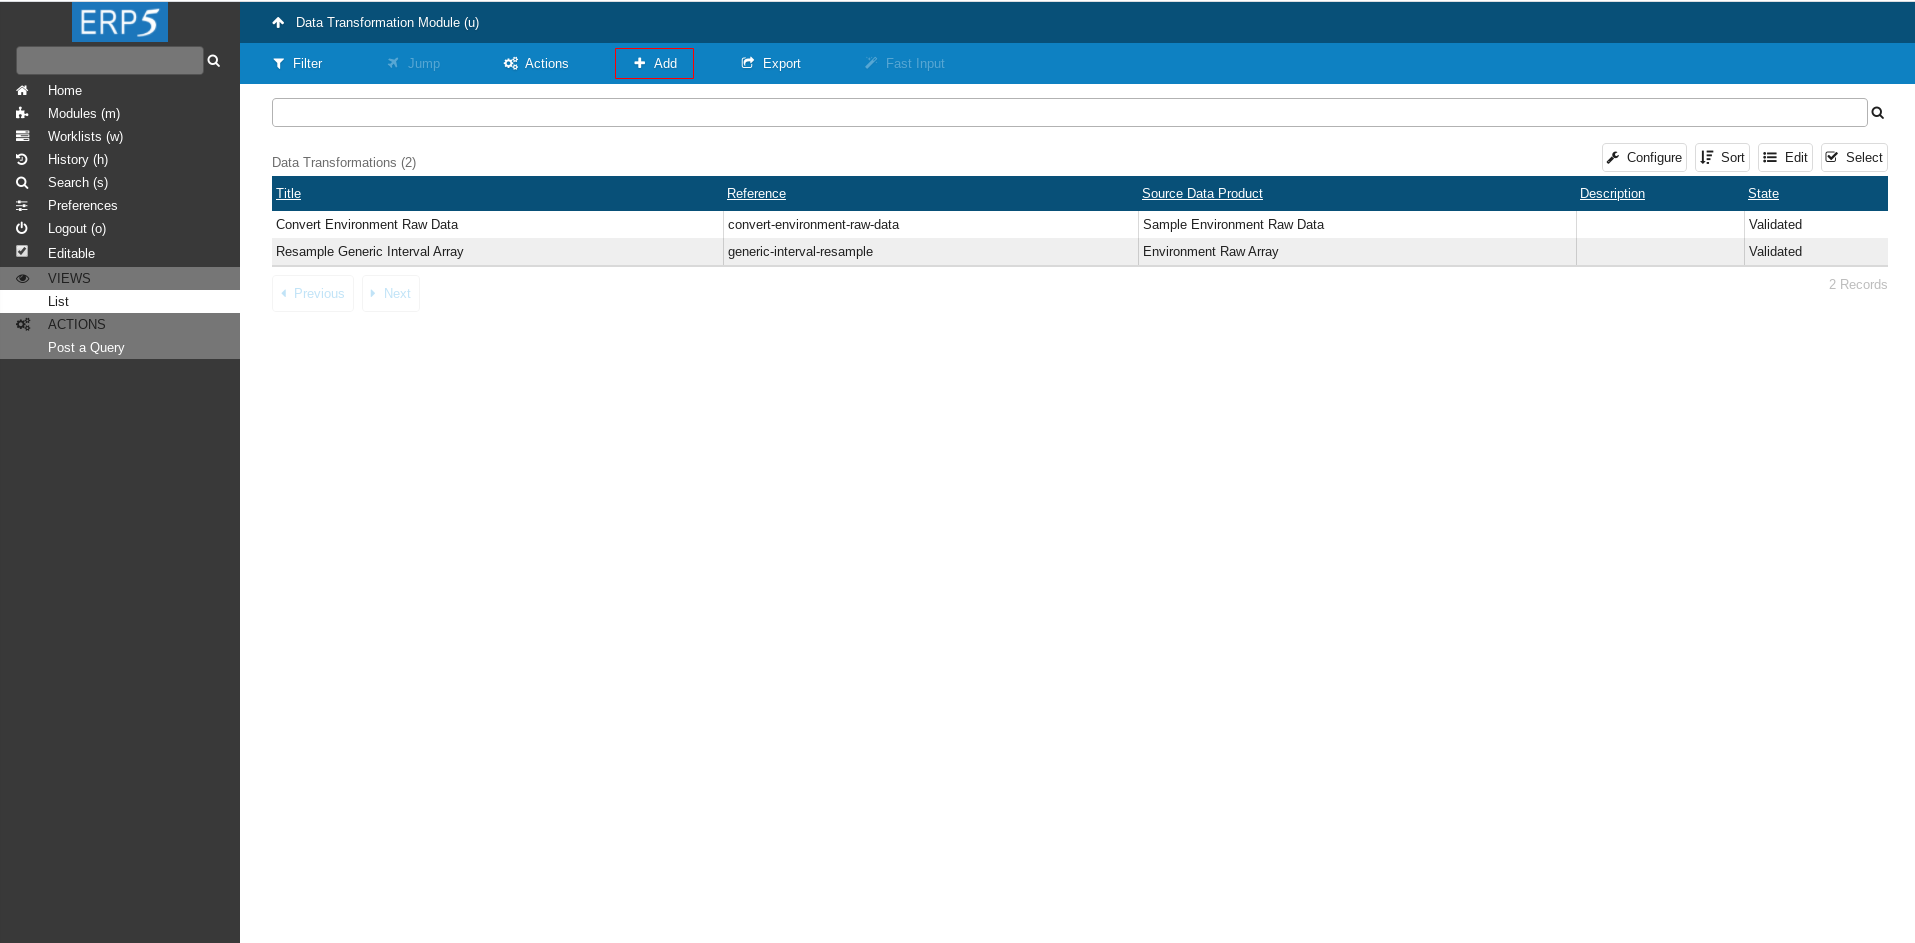
Click on Add to add a new Data Transformation.
Create Data Transformation

Click on Create Document to continue.
Fill The Form

Chose descriptive title and reference. For example
Title : Predict Pressure
Reference : predict-environment-pressure-data
For Initial Product we choose the Data Product we created in HowTo Resample Data tutorial, as we want to do the prediction on the resampled data.
At the end click Save to save the changes
Fill The Form Cont.
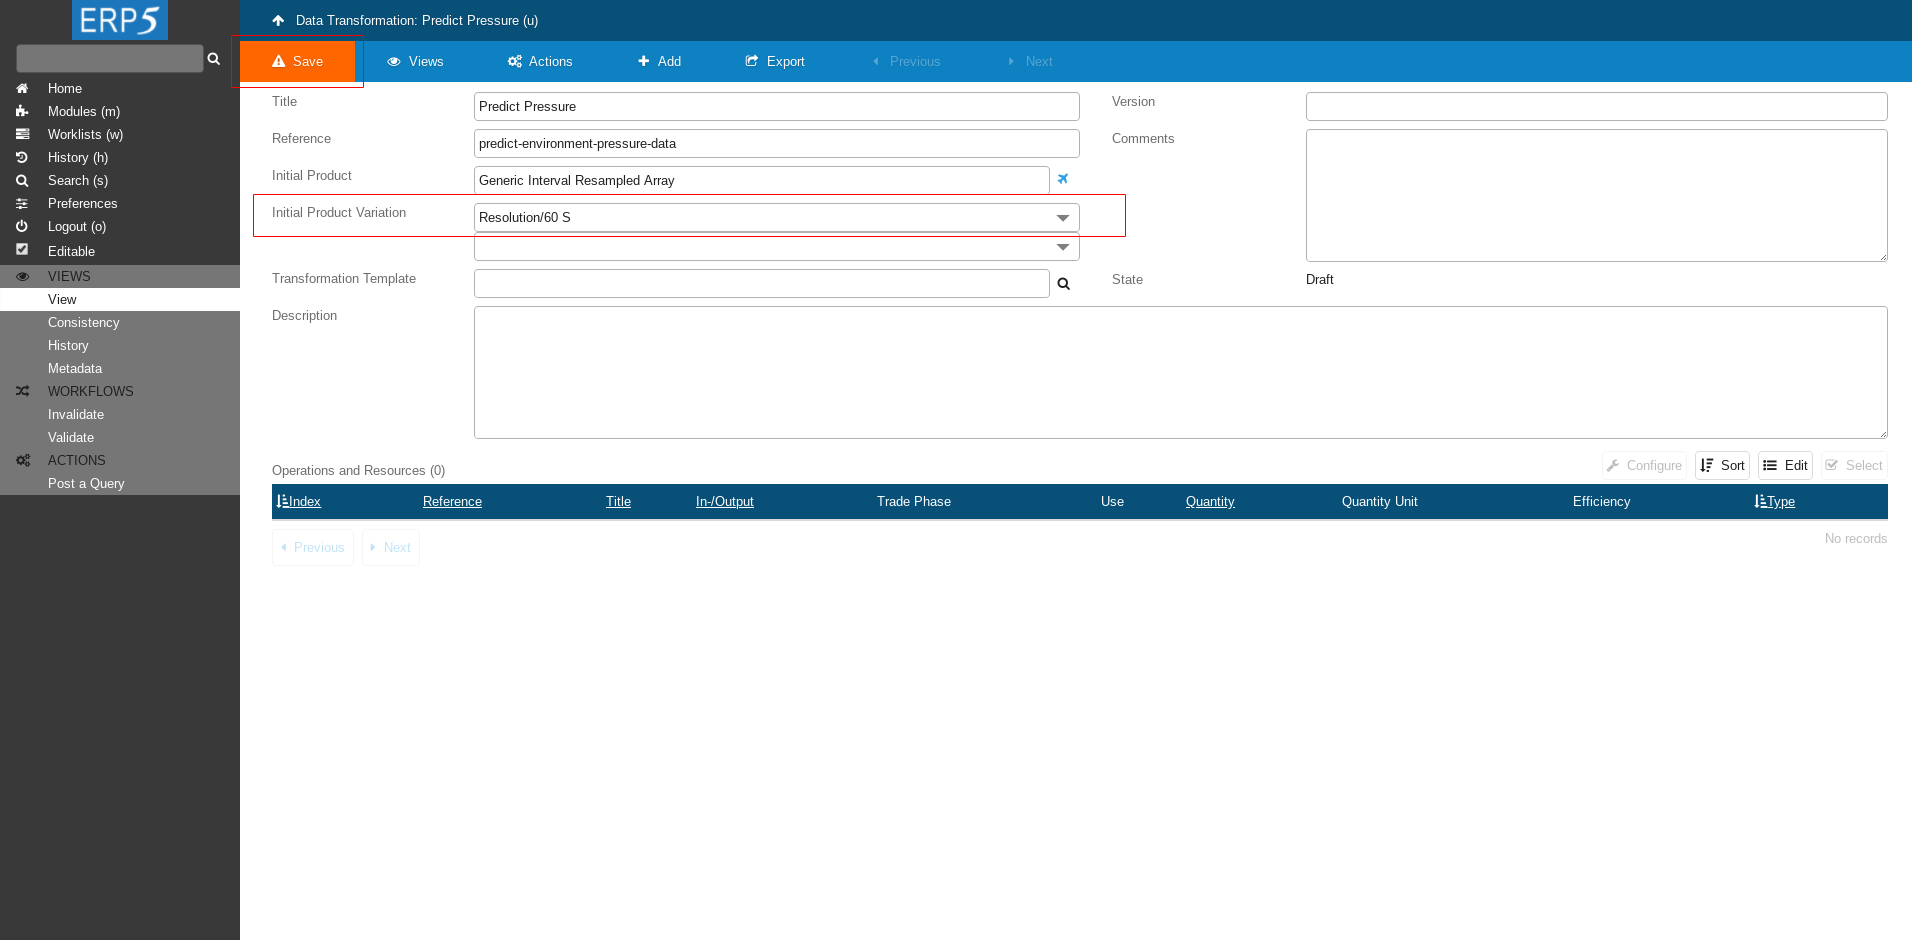
After filling in the Initial Product and saving, values will appear in Initial Product Variation field.
Choose Resolution/60 S as we want to use 60 seconds resampled data.
At the end click Save to save the changes
Data Transformation Lines
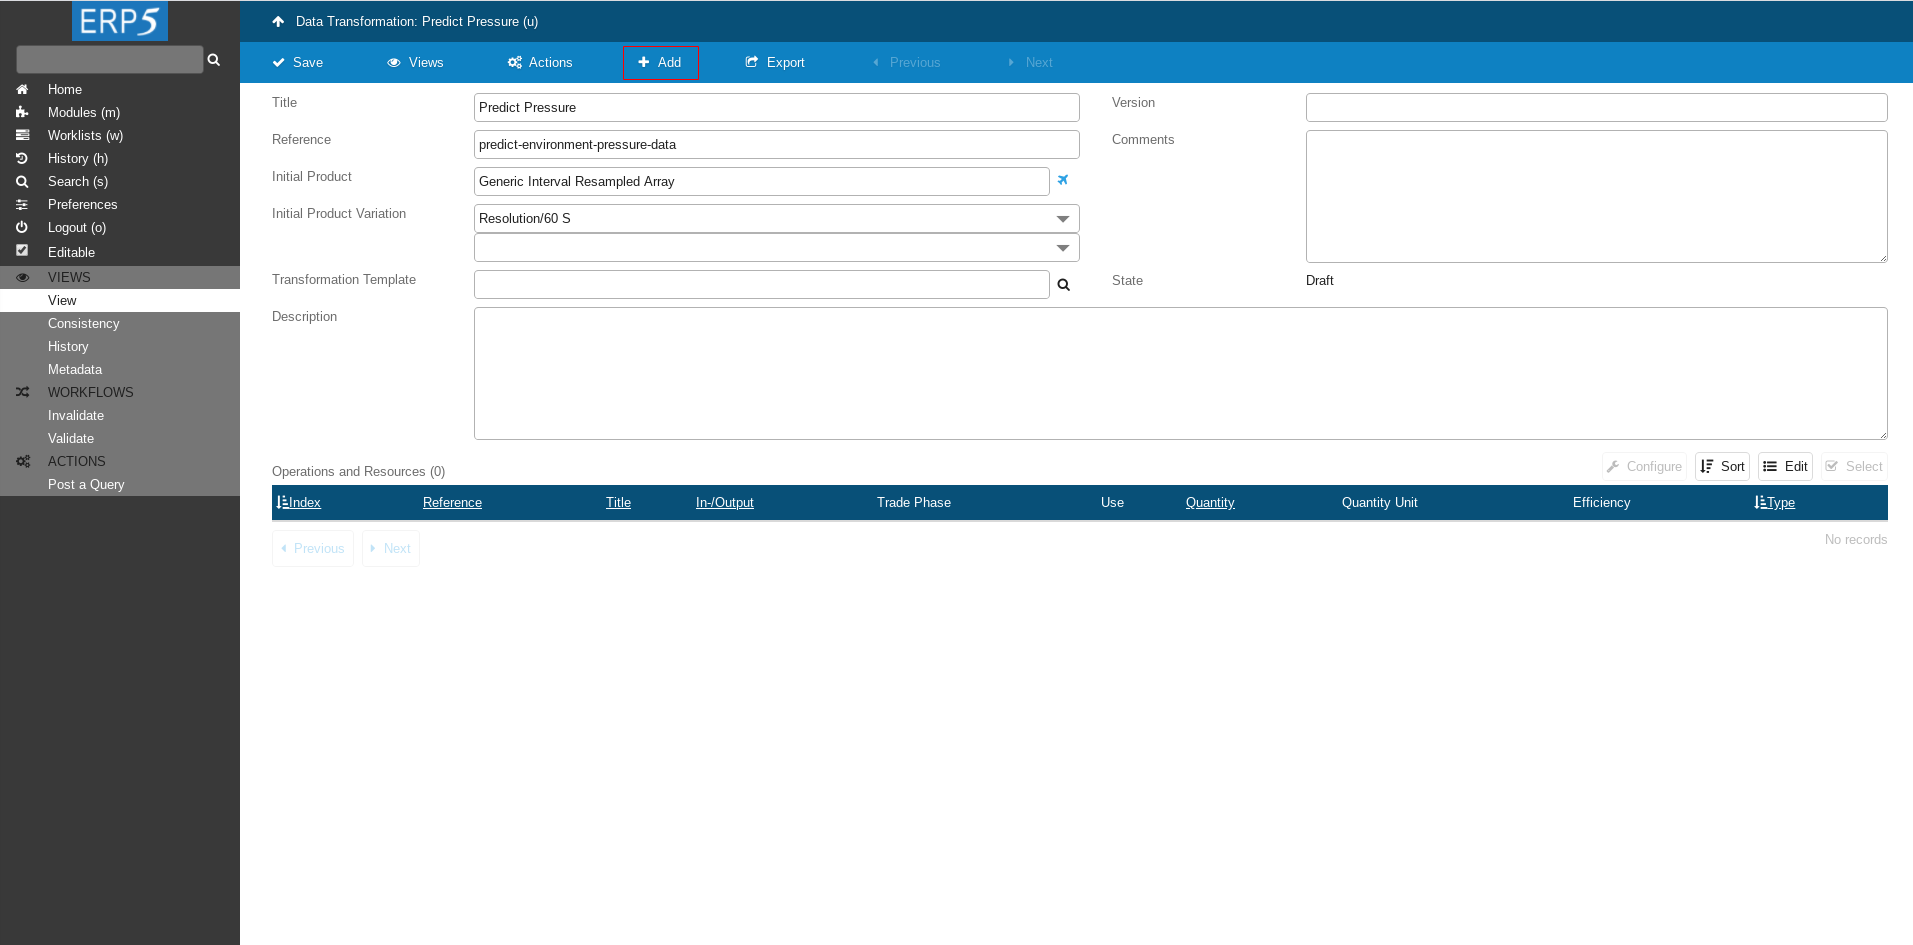
Click on add button to add a Data Transformation Line.
Create Operation Line
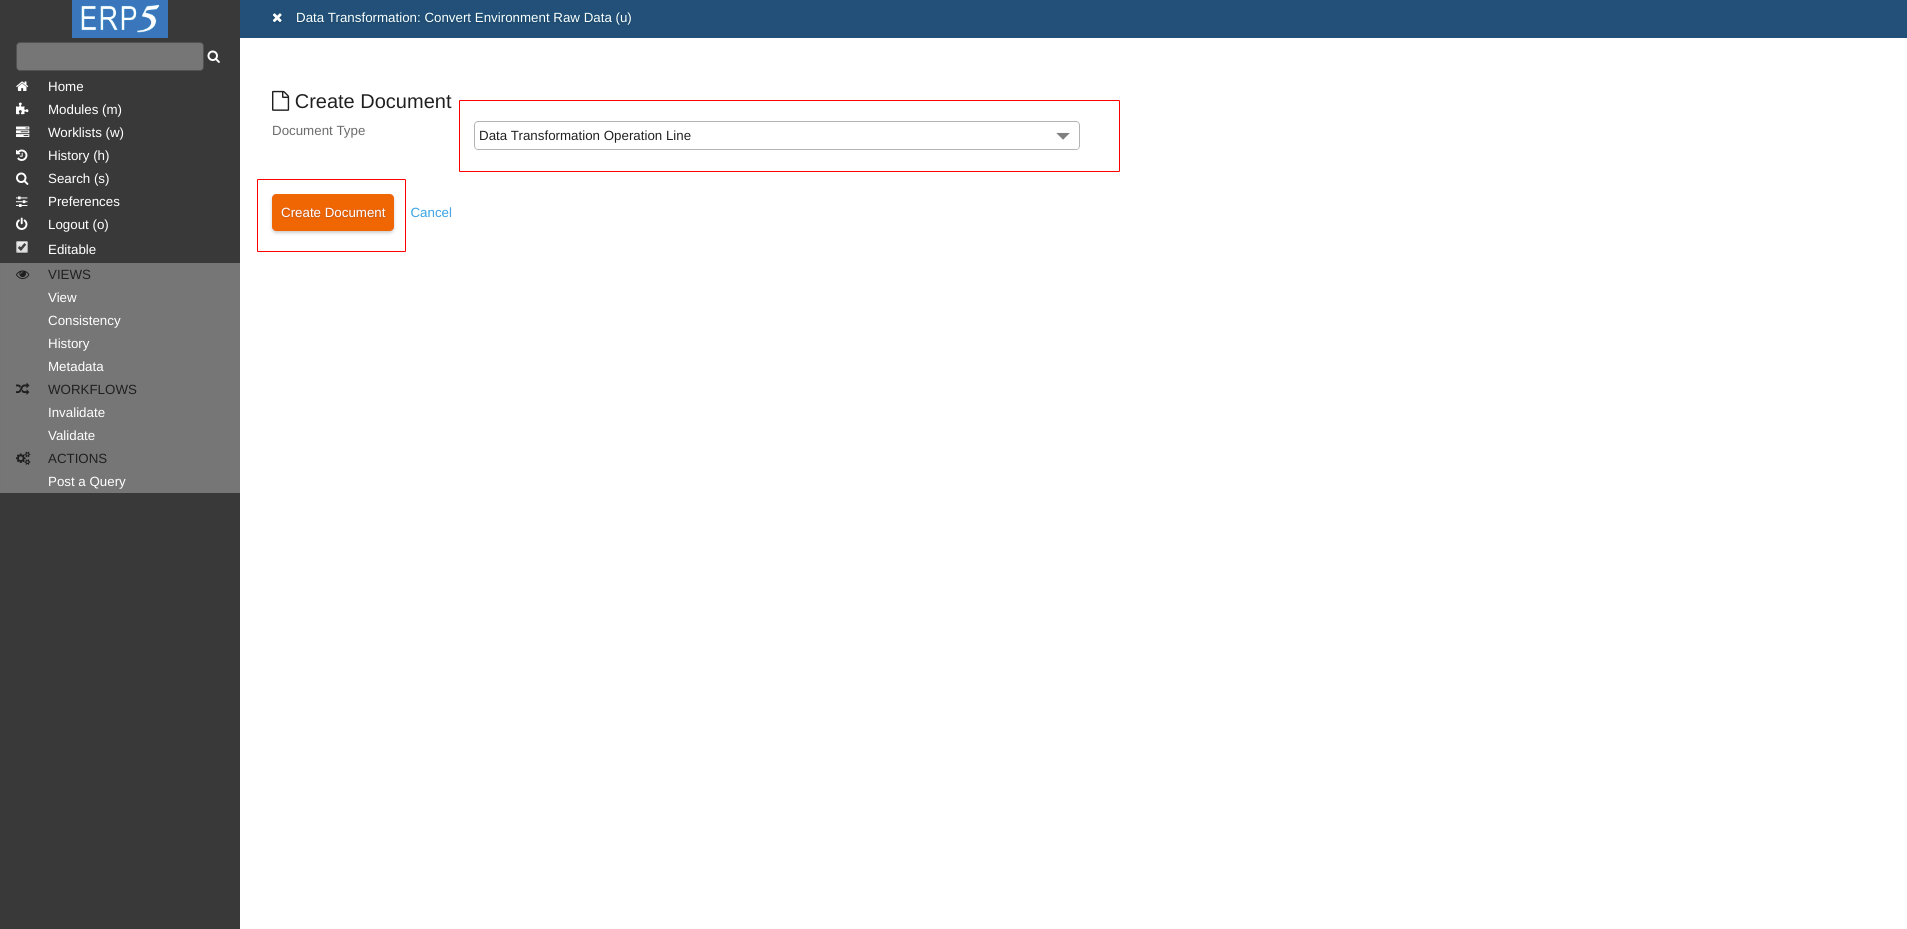
Choose Data Transformation Operation Line for Document Type and click on Create Document.
Fill The Form

Fill the form with followig values
Title: Predict Pressure
reference: data_operation
Data Operation: put the name of the Data operation that we created at the beginning of this tutorial - Predict Pressure
Trade Phase: Data/Convert
Quantity: 1
Quantity Unit: Unit/Piece
At the end click on Save to save the changes.
Fill The Form Cont.
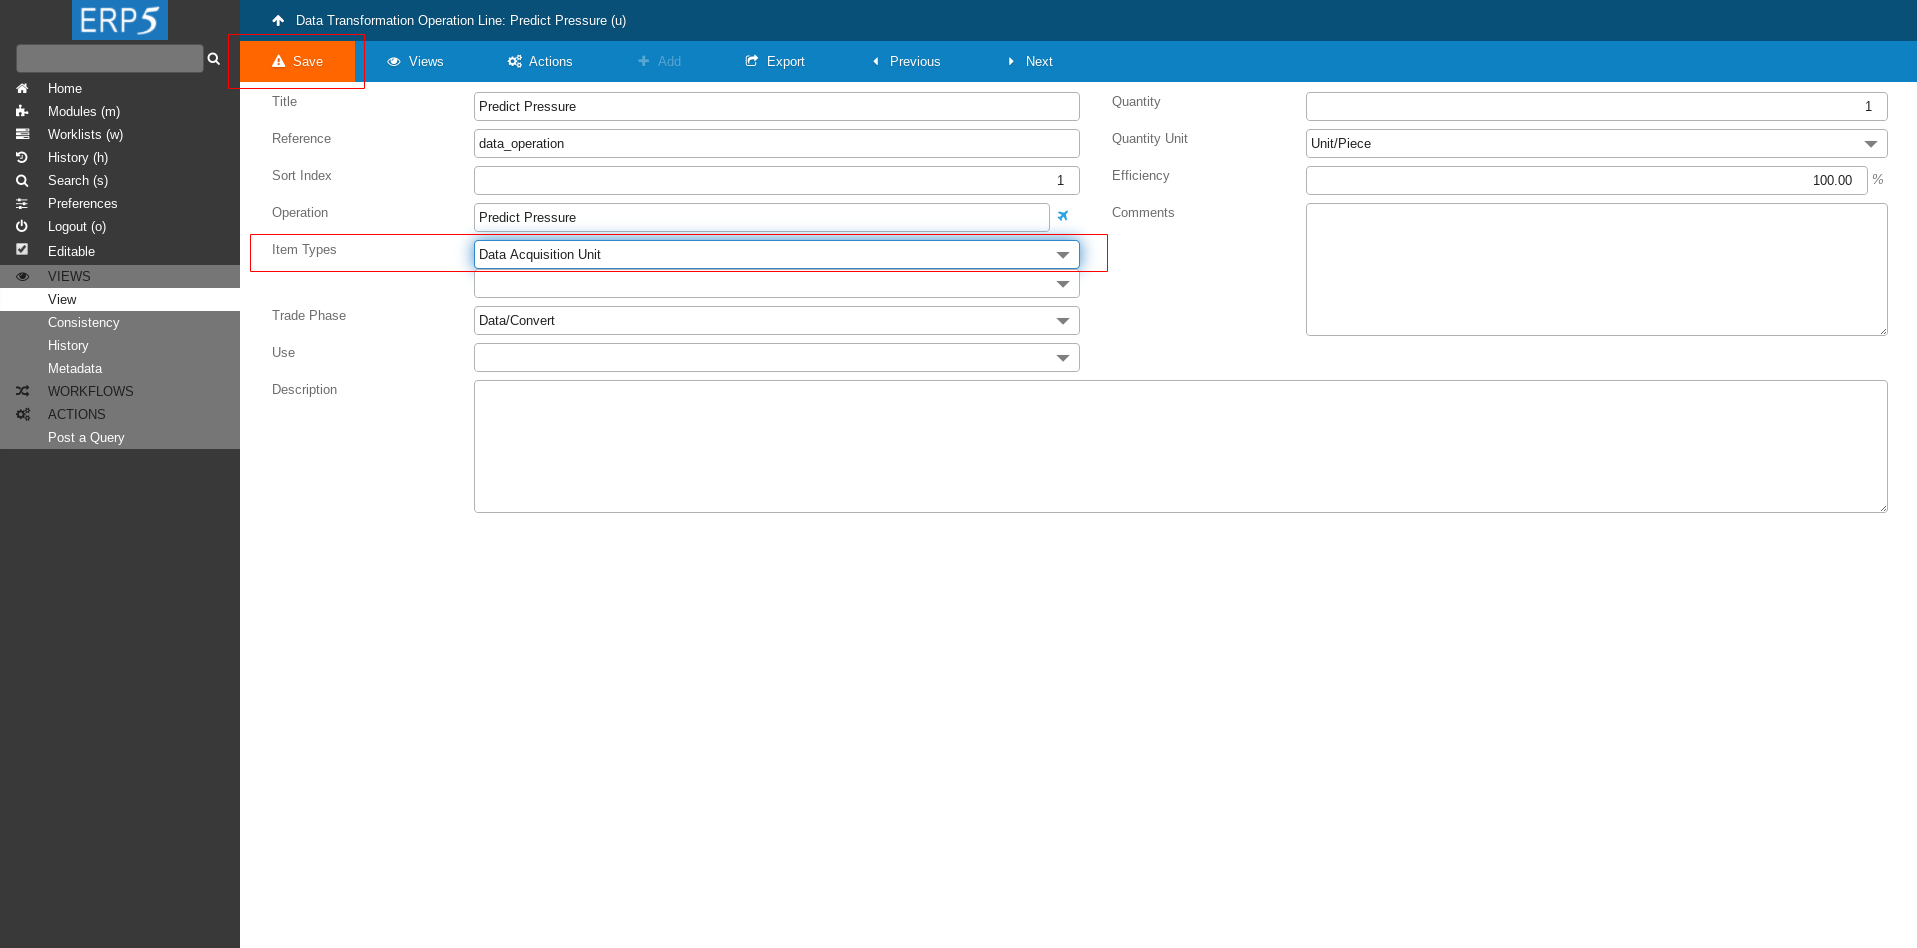
After saving the changes a new field Item Types will appear.
Choose Data Acquisition Unit for Item Types and save.
Back To Data Transformation

Once needed fields are filled and saved go back to Data Transformations view by clicking on the upper panel.
Data Transformation Lines

Add another Data Transformation Line.
Create Transformation Line
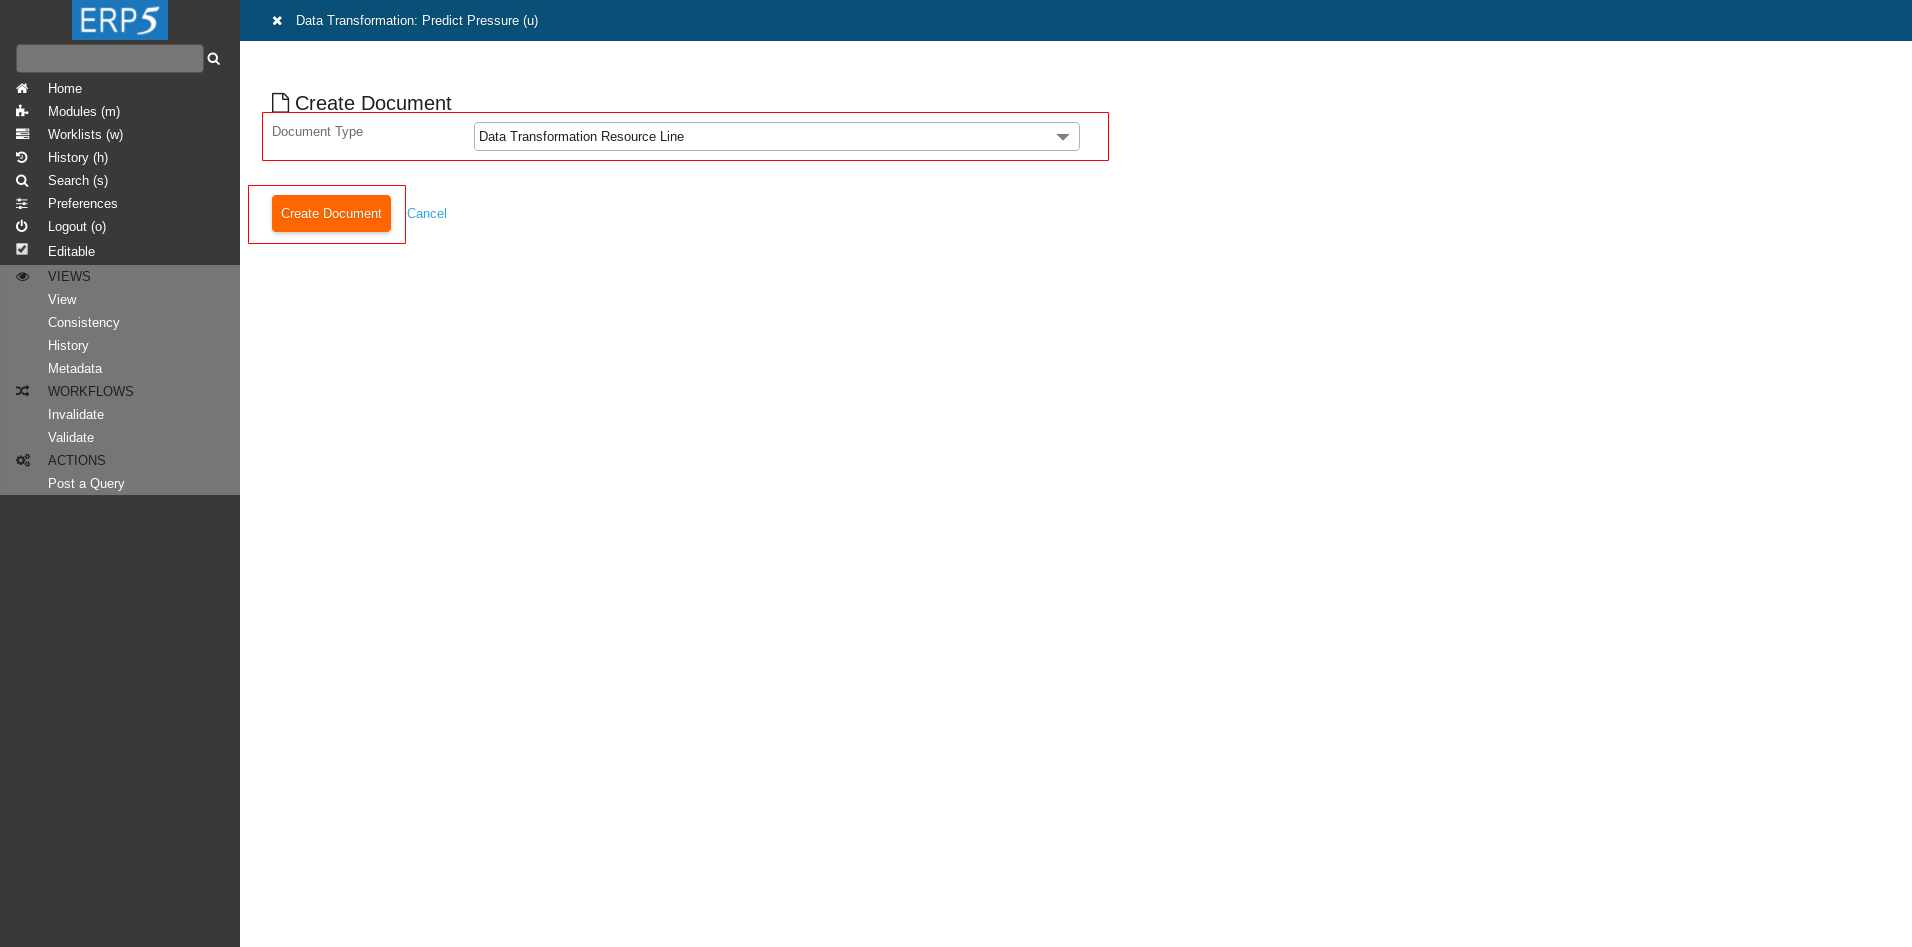
Now for Document Type choose Data Transformation Resource Line and click on Create Document.
Fill The Form

Fill the form with following values
Title: Resampled Data
Reference: in_array
Data Product: put the name of the Data Product that we created in HowTo Resample Data tutorial - Generic Interval Resampled Array
After filling in the Data Product name click Save to save the intermediate changes.
After saving a new field Item Types will appear.
Fill The Form Cont.

Continue filling the form as shown on the screenshot
Item Types: Data Array
Trade Phase: Data/Convert
Default Variation: Resolution/60 S
Quantity: -1
Quantity Unit: Unit/Piece
At the end don't forget to save the changes.
Add Output Line
Head back to Data Transformation and add one more Transformation line.
Create Transformation Line
Again for Document Type choose Data Transformation Resource Line and click on Create Document.
Fill The Form
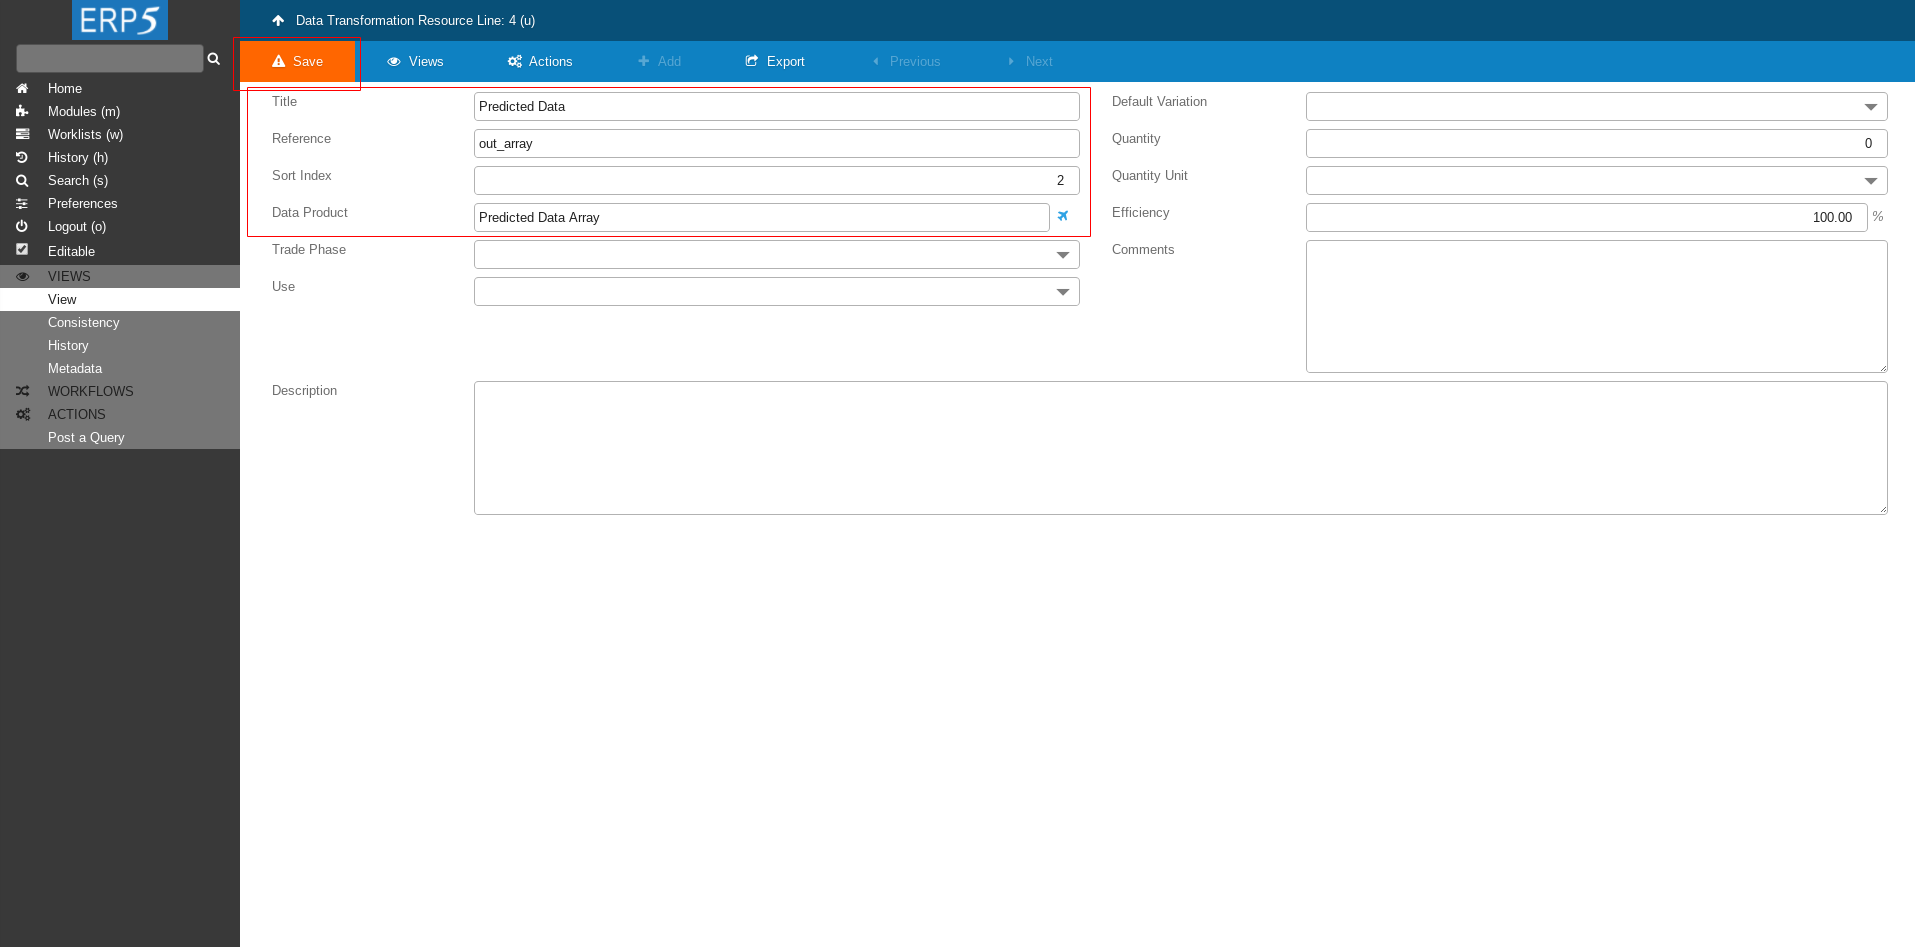
Fill the form with following values
Title: Predicted Data
Reference: out_array
Data Product: put the name of the Data Product that we created earlier in this tutorial - Predicted Data Array.
Then click Save to save the intermediate changes.
After saving a new field Item Types will appear.
Fill The Form Cont.

Continue filling the form as shown on the screenshot
Item Types: Data Array
Trade Phase: Data/Convert
Use: Big Data/Ingestion/Stream Ingestion
Quantity: 1
Quantity Unit: Unit/Piece
At the end don't forget to save the changes.
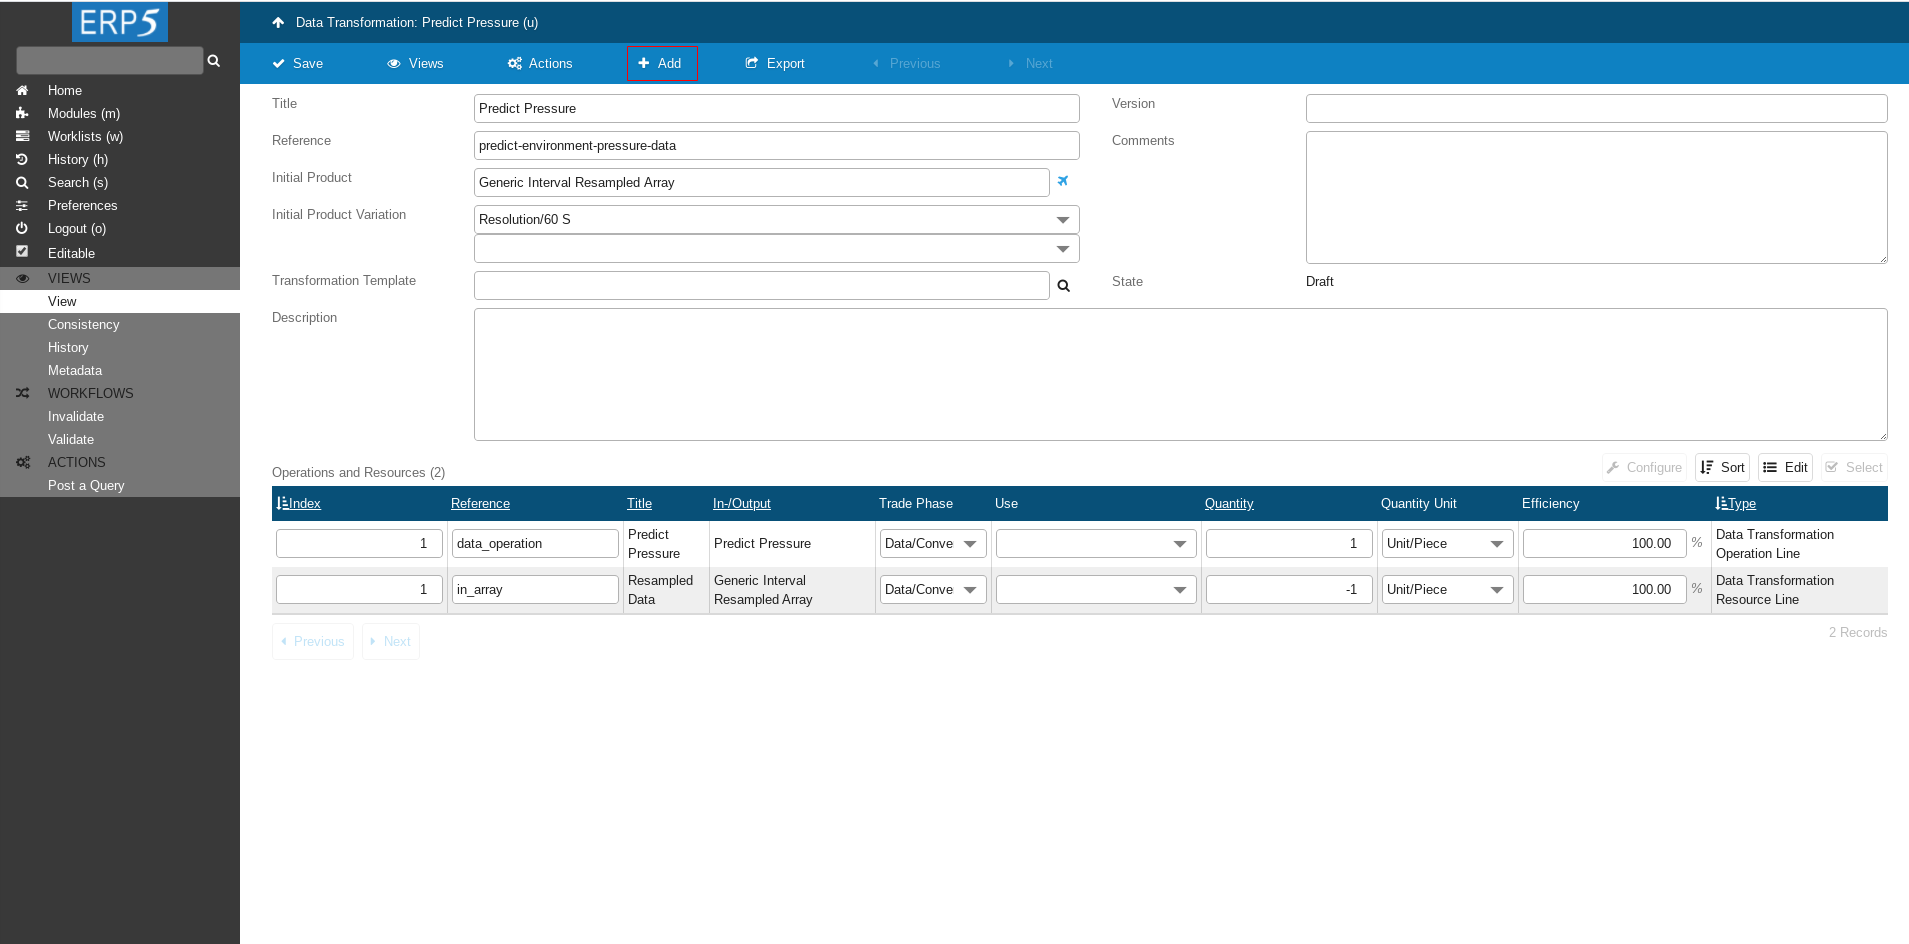
Data Transformation
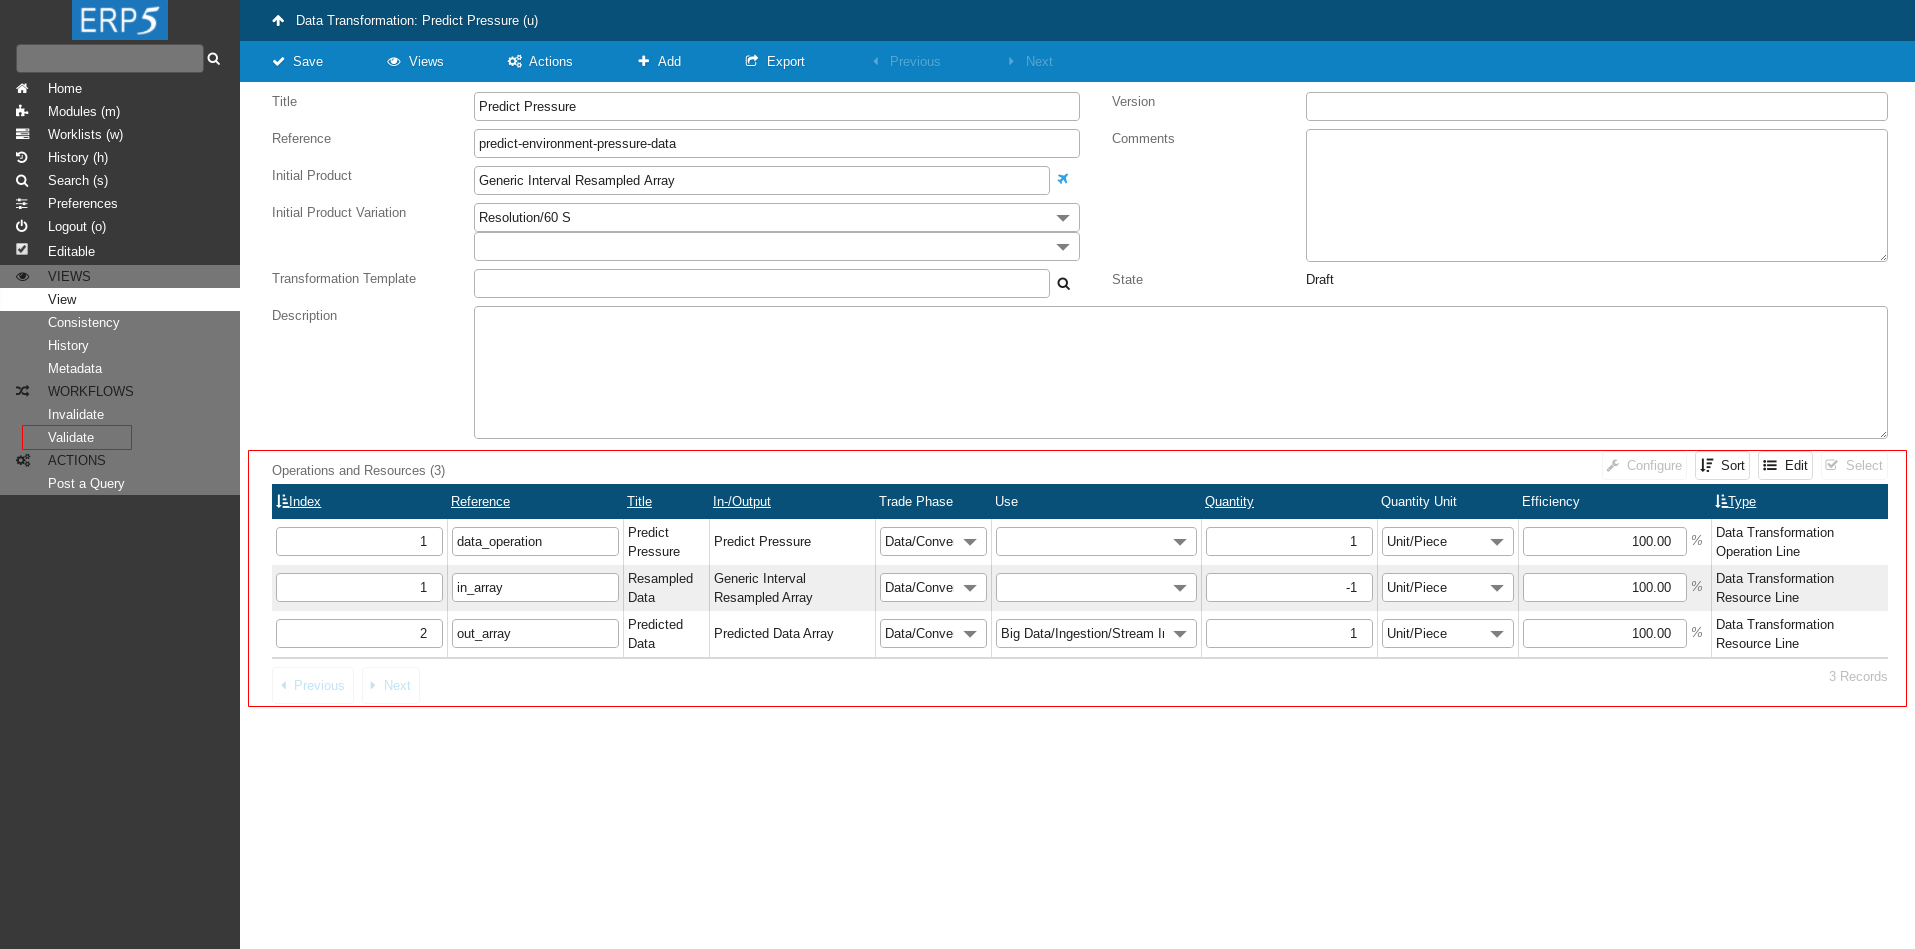
Head back to Data Transformation.
Now you can see that we have 3 Data Transformation Lines.
The first line defines what operation will be done.
The second line defines on what the operation will be done - the input.
The last line defines the output.
The very last step is to validate the Data Transformation.
Click on Validate on the left side panel to validate the Data Transformation.
Confirm Validation

Click on Validate to confirm the Validation.
Data Analysis
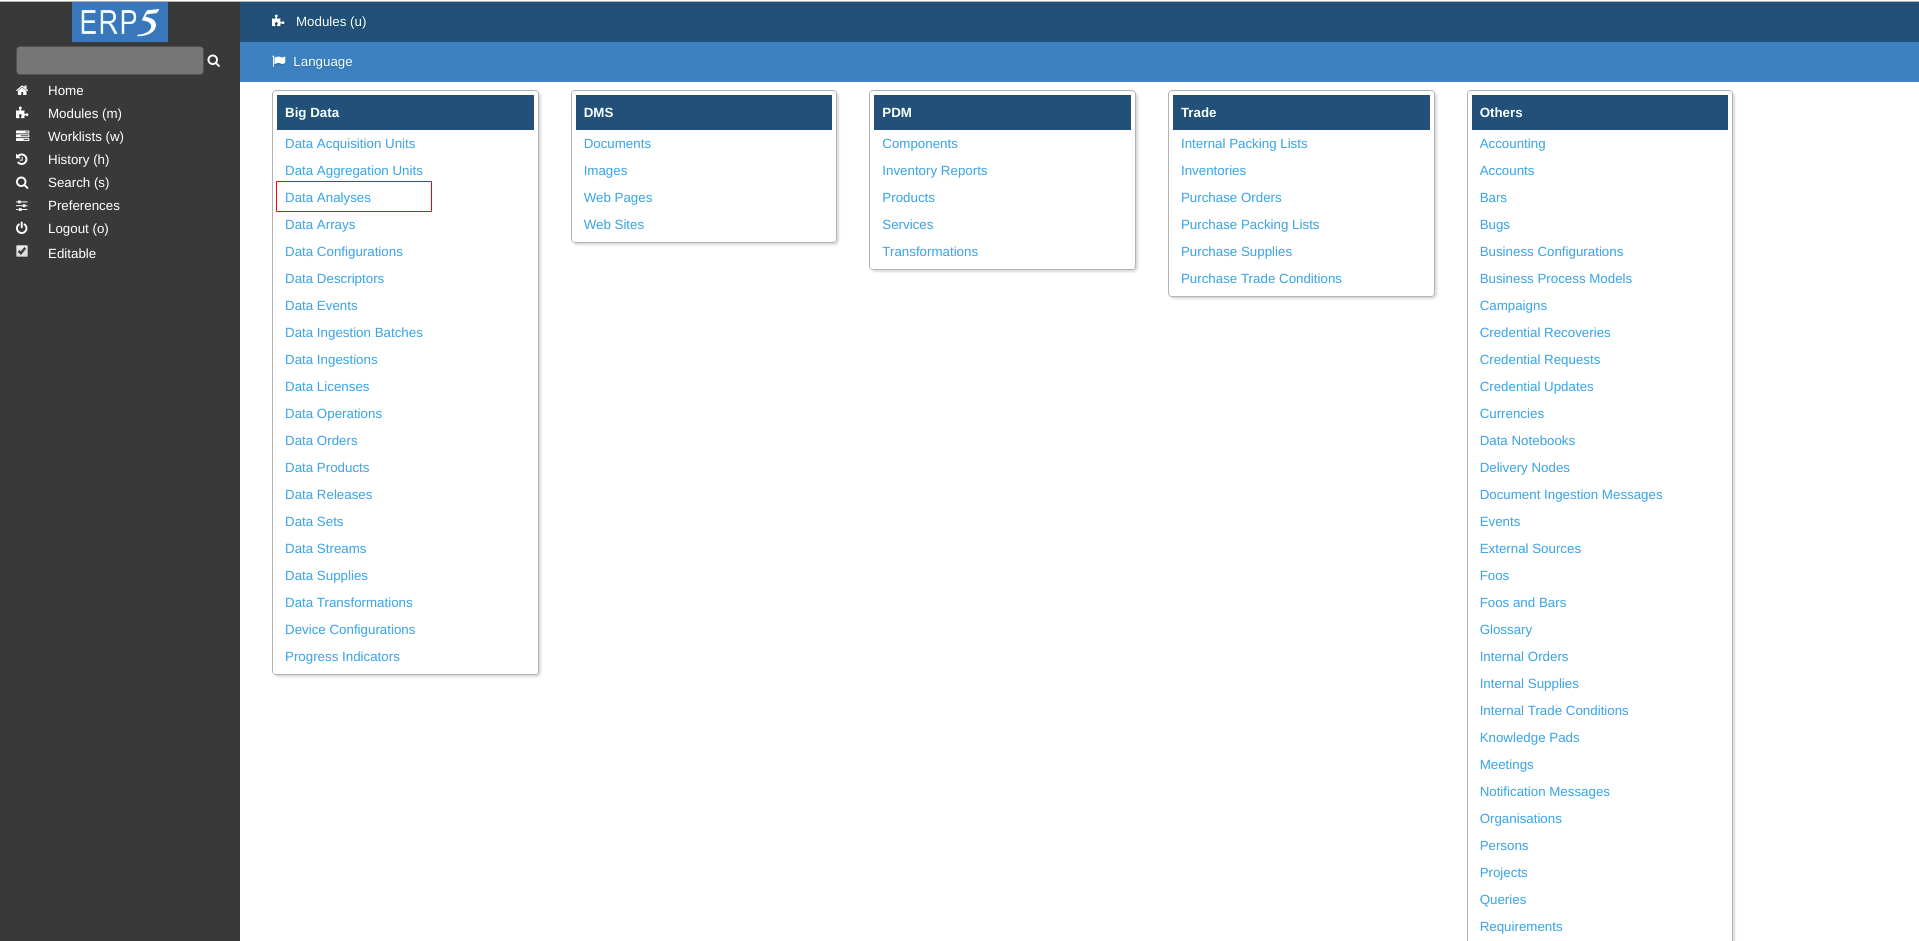
Go to Data Analyses module.
Data Analysis

After few minutes in Data Analysis Module a new Data Analysis called Predict Pressure will appear.
Data Array Module

Go to Data Array Module to see the data.
Data Array
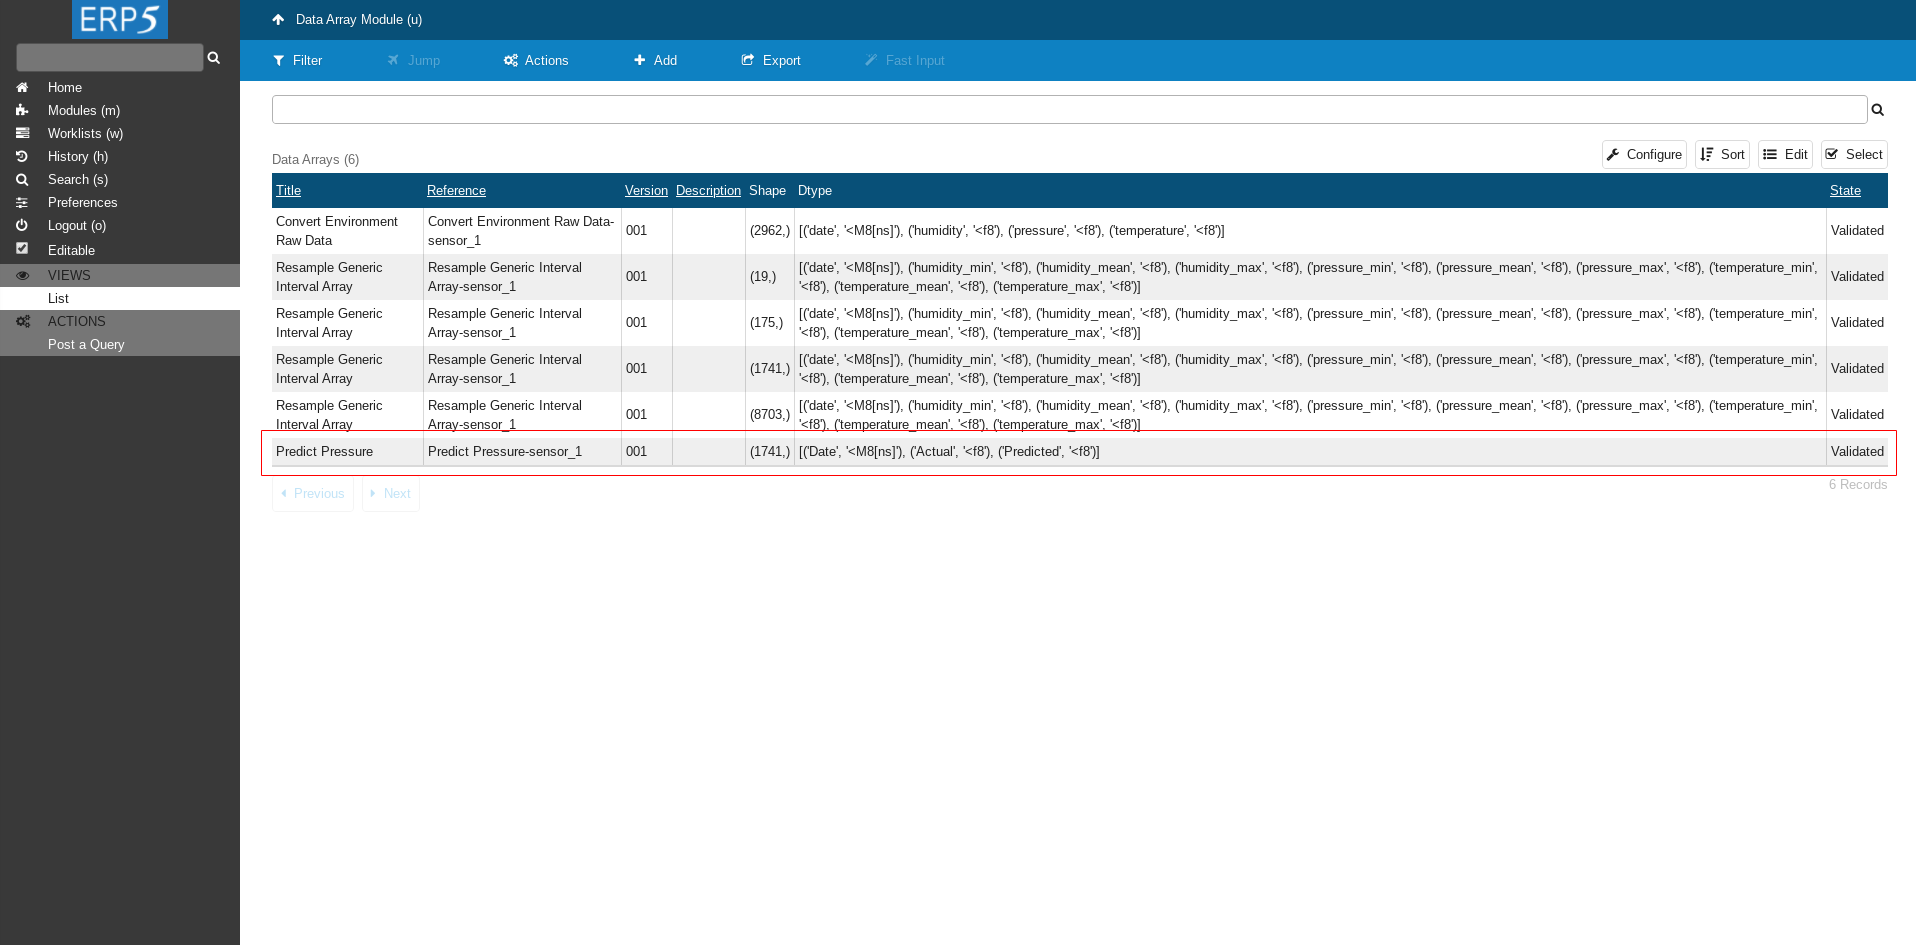
Here we can see the newly created Data Arrays with prediction results - Predict Pressure.
Click on it to navigate to the array.
Data Array
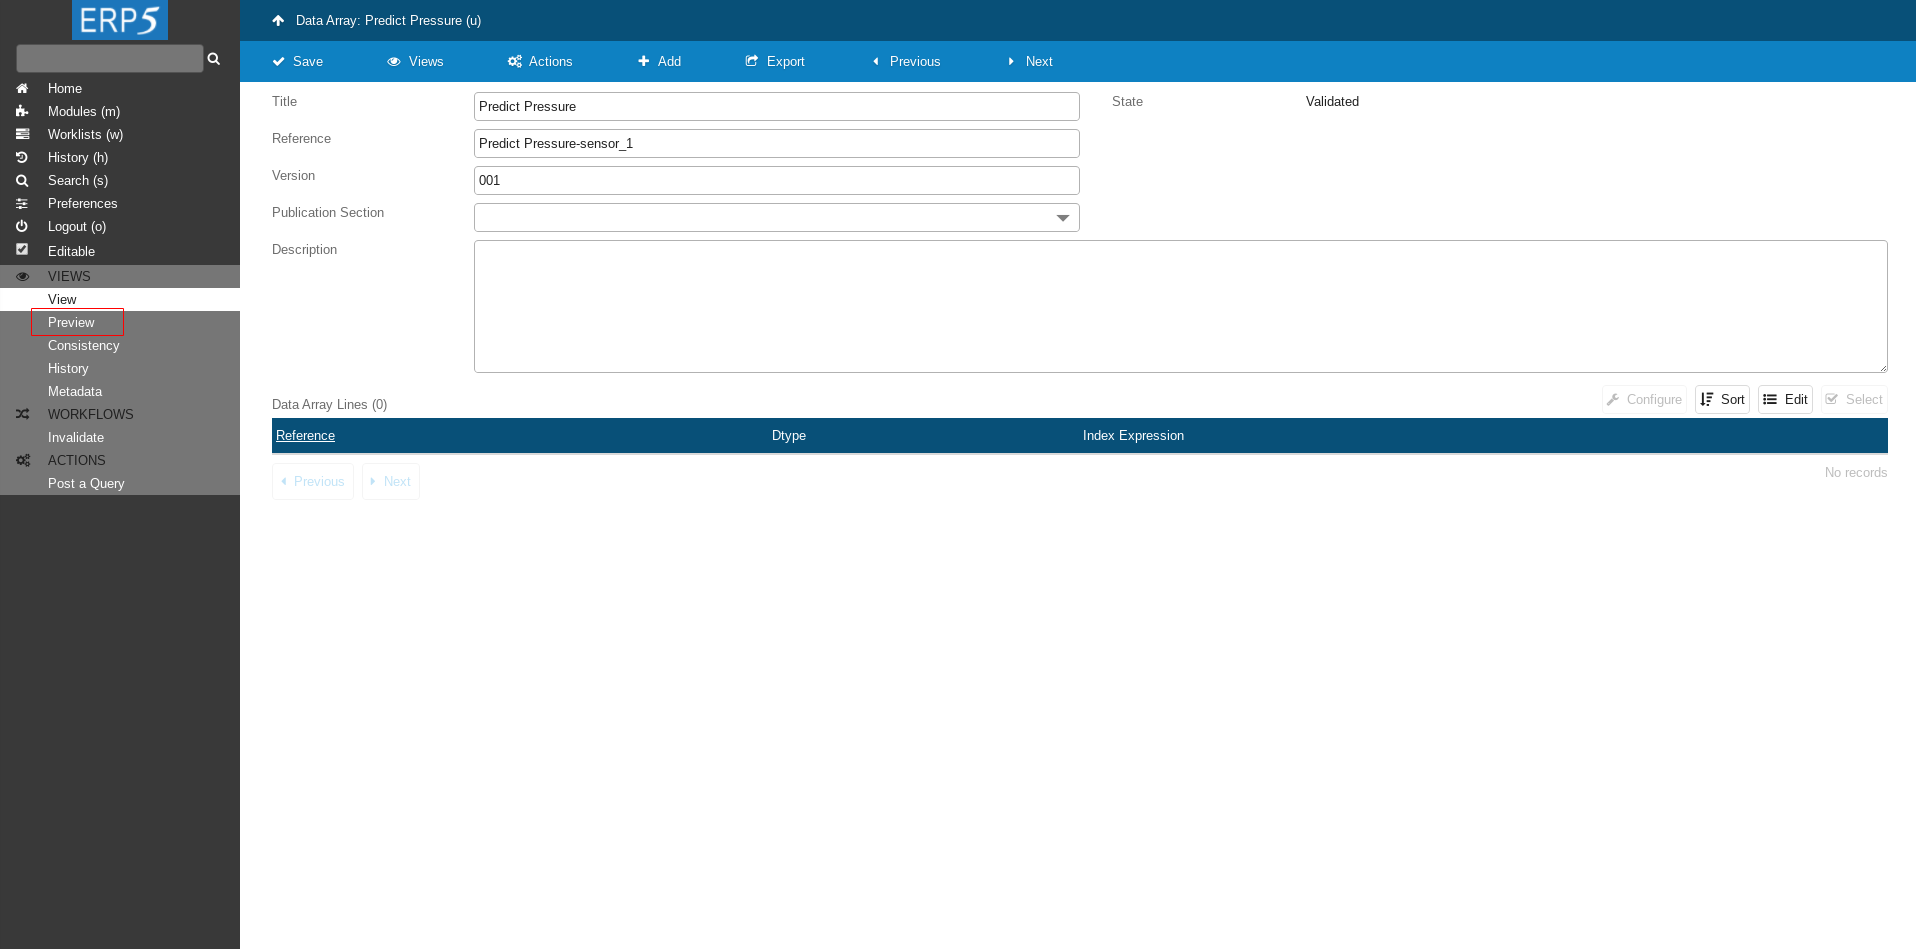
Click on Preview to see the data.
Note it might take few minutes (<10) until data appears.
Data Array
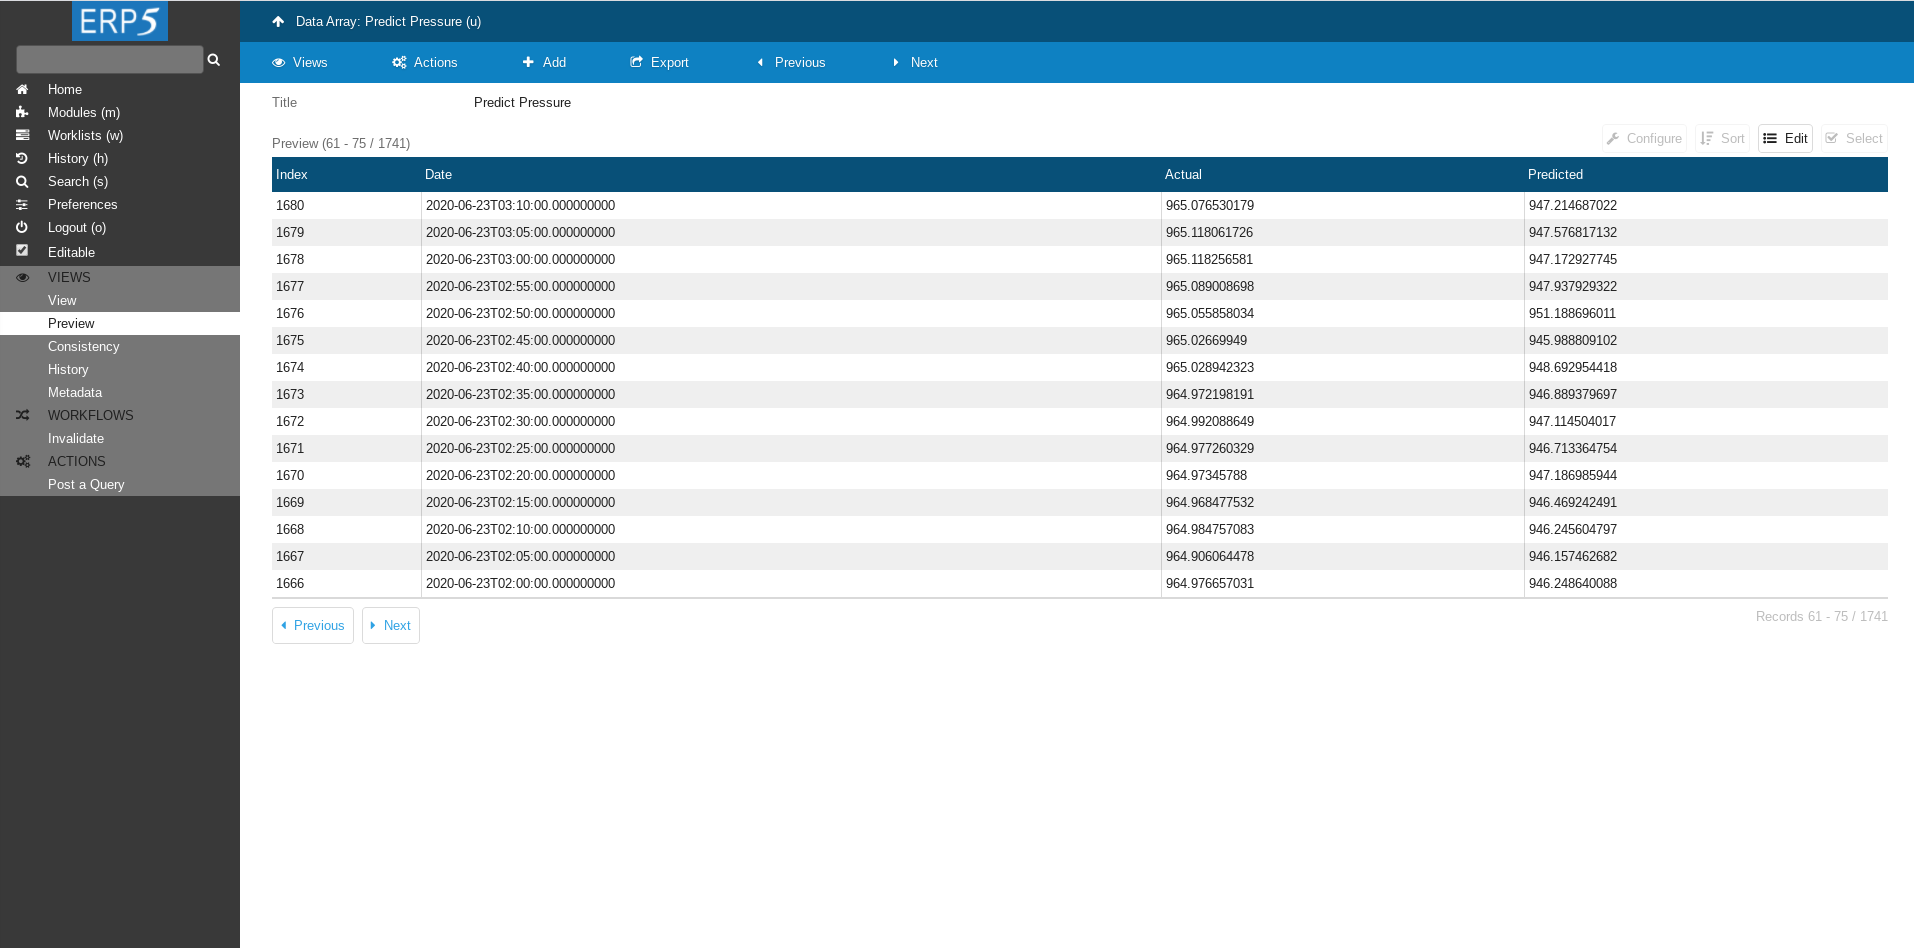
Data is here!
Notebook Module

On Modules page click on Notebooks.
Note: On newer Wendelin versions you may find the Notebooks module in the category Others and no longer in the category Big Data.
Add Notebook
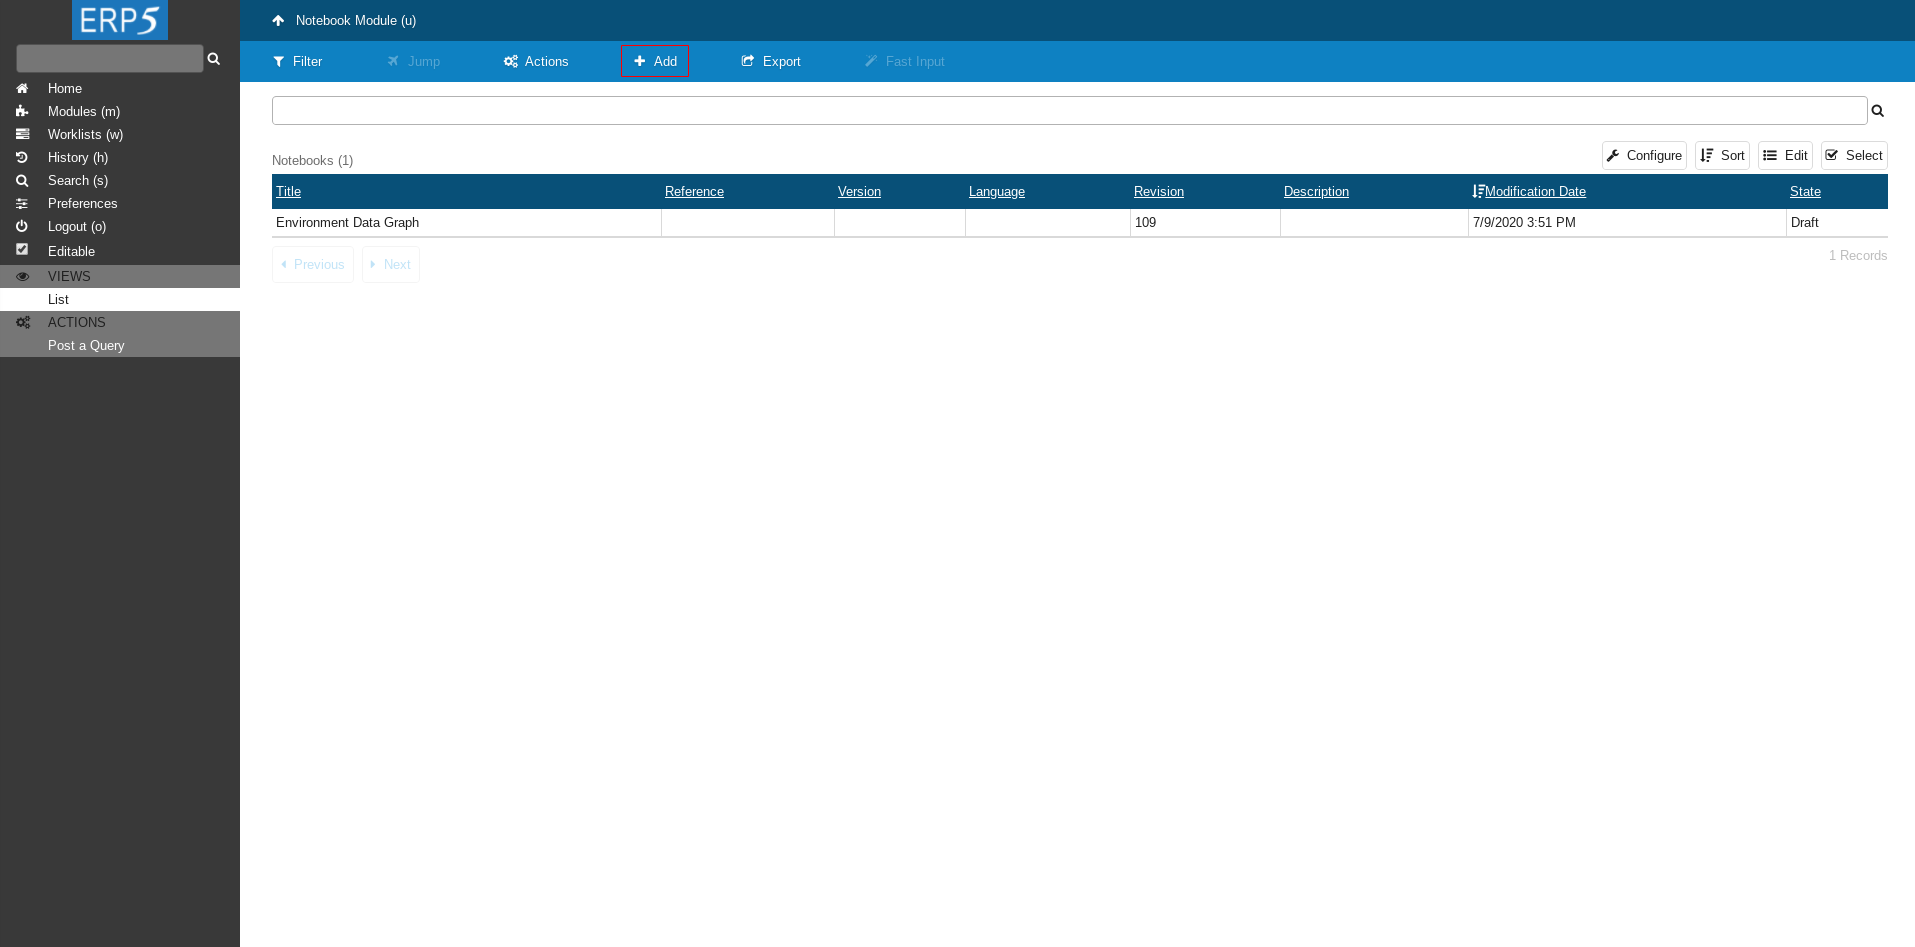
Click on Add to add a new Notebook.
Create Notebook
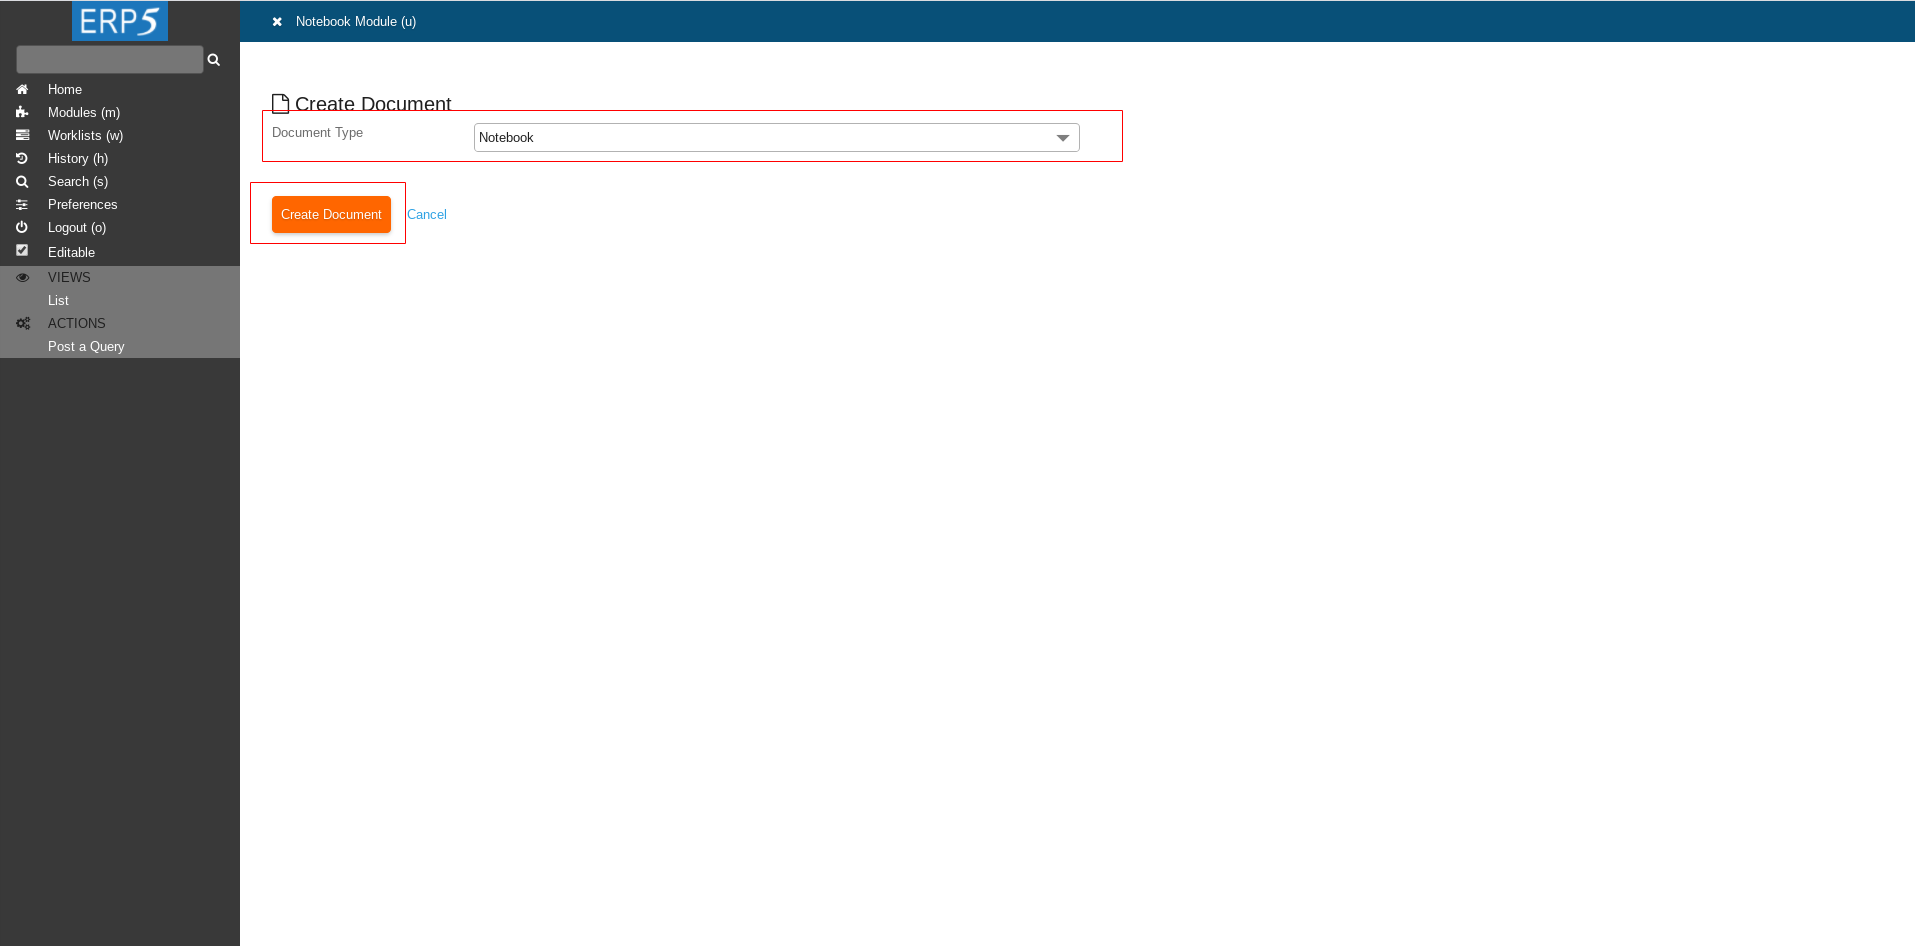
Click on Create Document to continue.
Notebook
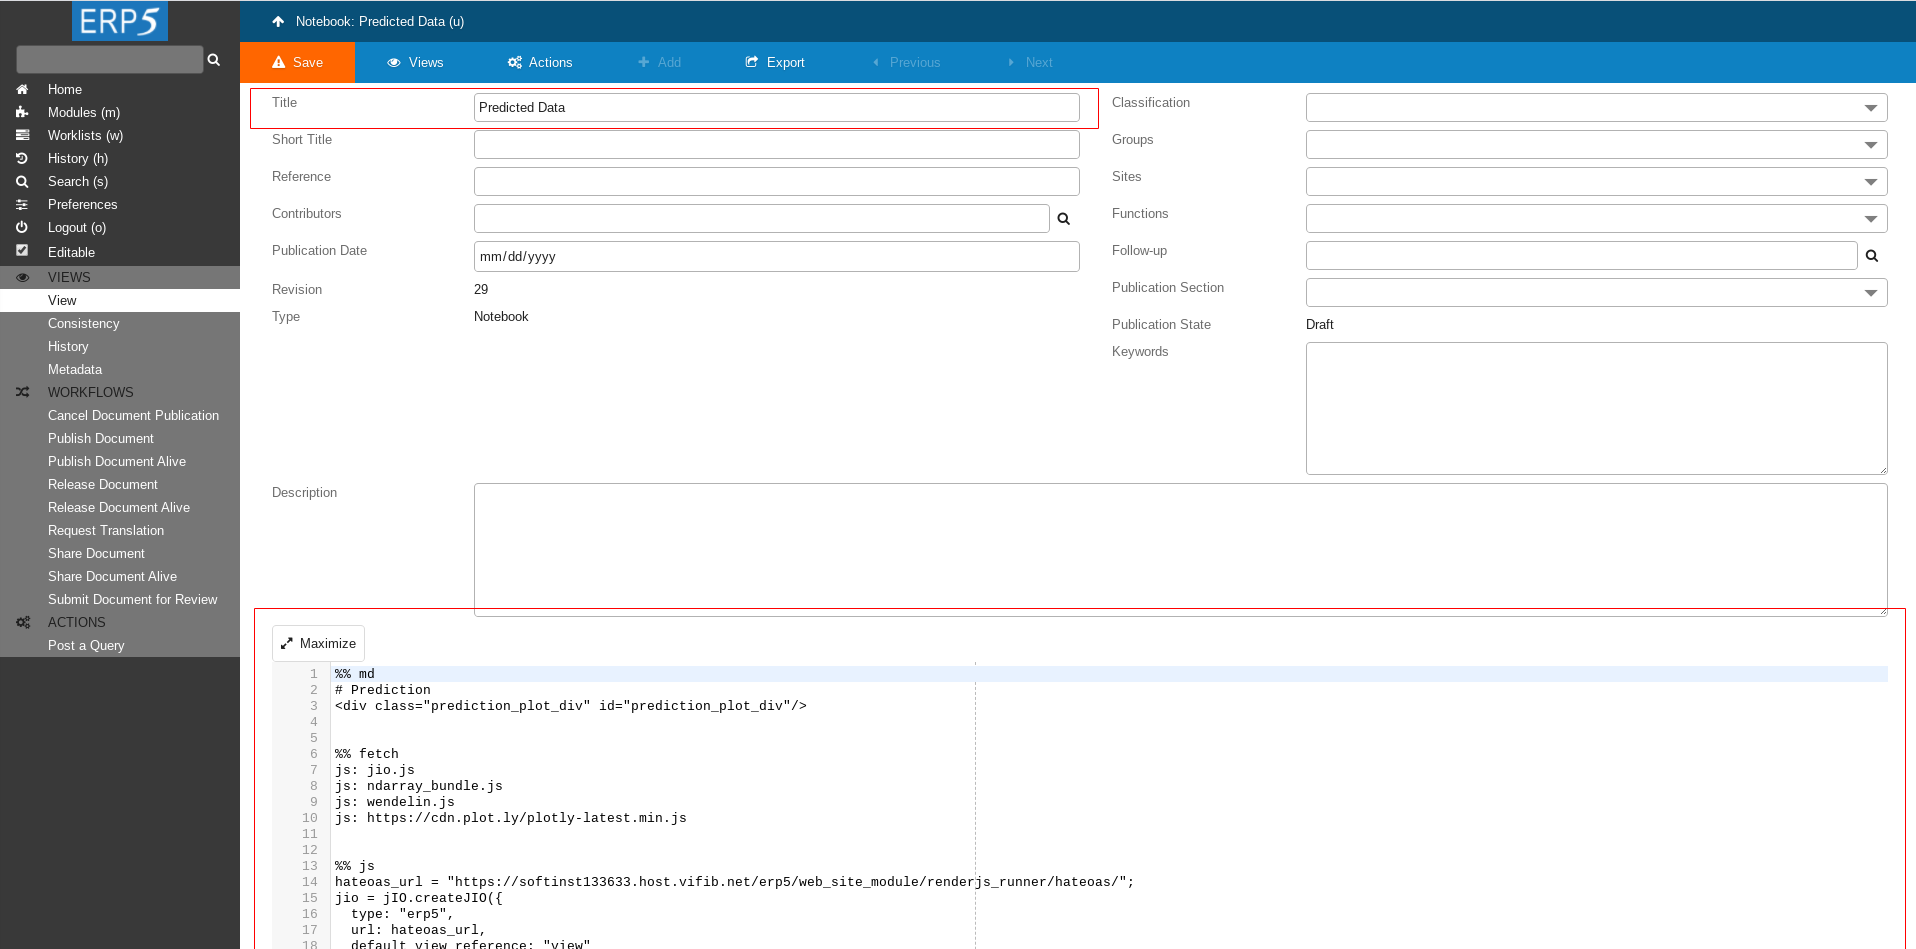
Fill in the Title.
The visualisation code will be at the bottom text area.
Notebook uses the same technology as Iodide.
To learn more about programming in Iodide environment checkout Iodide homepage.
Visualisation Script
%% md
# Prediction
<div class="prediction_plot_div" id="prediction_plot_div"/>


%% fetch
js: jio.js
js: ndarray_bundle.js
js: wendelin.js
js: https://cdn.plot.ly/plotly-latest.min.js


%% js
hateoas_url = "https://softinst133633.host.vifib.net/erp5/web_site_module/default_wendelin_front/hateoas/";
jio = jIO.createJIO({
  type: "erp5",
  url: hateoas_url,
  default_view_reference: "view"
});

gadget = {
  getSetting: function(property) {
    return new RSVP.Queue()
      .push(function () {
        if (property == "hateoas_url") {
          return hateoas_url;
        }
        return;
      });
  },
  jio_getAttachment: function(id, url, parameter_dict) {
    return jio.getAttachment(id, url, parameter_dict);
  },
  jio_get: function(id) {return jio.get(id);}
}

var prediction_label_list = ["Date", "Actual", "Predicted"];
var prediction_graph = document.getElementById('prediction_plot_div');

plot_prediction();

function plot_prediction() {
  return getPredictionData()
    .push(function (data) {
      console.log("data")
      console.log(data)
      var layout = {barmode: 'stack','title' :'Predict Presure Based on Humidity'};
      Plotly.plot(prediction_graph,data, layout);
    });
}

function getPredictionData(start_date, stop_date){
  function unpack(rows, key) {
    return rows.map(function(row) { return row[key]; });
  }

  array_id = "data_array_module/90";
  prediction_graph_data=[];

  var start_index = 0;
  var stop_index = undefined;

  return jio.allDocs({
    query: 'portal_type:"Data Analysis Line" AND ' +
           'title: "Predicted Data" AND ' +
           'resource_reference:"environment-predicted-array" AND ' +
           'simulation_state:"started"'
  })
    .push(function (result) {
      var data_analysis_line_id = result.data.rows[0].id;
      return jio.allDocs({
        query: 'portal_type:"Data Array" AND ' +
               'aggregate_related_relative_url:"' + data_analysis_line_id +'"'
      });
    })
    .push(function (result) {
      array_id = result.data.rows[0].id;
      return wendelin.getArrayRawSlice(gadget, array_id, 0, 1);
    })
    .push(function (result) {
      array_start_date = wendelin.convertFirstColToDate([[result.data[0]]])[0][0];
      if (start_index === undefined) {
        start_index = Math.max(0, Math.ceil((start_date - array_start_date) / (frequency*1000))),
        stop_index = Math.ceil((stop_date - array_start_date) / (frequency*1000));
      }
      return wendelin.getArrayRawSlice(gadget, array_id, start_index, stop_index);
    })
    .push(function(result) {
      for (i = 0; i < prediction_label_list.length; i += 1) {
        prediction_graph_data = prediction_graph_data.concat(nj.unpack(result.pick( null, prediction_label_list[i])));
      }
      return prediction_graph_data
    })
    .push(function(result){
      var filtered_graph_data = [];
      for (var i=0; i<result.length; i++) {
        if (result[i][0] != 0) {
          filtered_graph_data.push(result[i]);
        }
      }
      return wendelin.convertFirstColToDate(filtered_graph_data)
    })
    .push(function (graph_data) {
      var actual_data = {
          type: "scattergl",
          mode: "markers",
          name: 'Real',
          x: unpack(graph_data, prediction_label_list.indexOf("Date")),
          y: unpack(graph_data, prediction_label_list.indexOf("Actual")),
          line: {color: '#17BECF'}
      };
      var predicted_data = {
          type: "scattergl",
          mode: "markers",
          name: 'Predicted',
          x: unpack(graph_data, prediction_label_list.indexOf("Date")),
          y: unpack(graph_data, prediction_label_list.indexOf("Predicted")),
          line: {color: '#7F7F7F'}
      };
      var data = [actual_data,predicted_data];
      return data
    });
}
Copy/paste the code to your notebook and save the changes.
Note: you will need to provide the URL of your instance in the script.
For that change the line :
hateoas_url = "https://softinstXXX.host.vifib.net/erp5/web_site_module/default_wendelin_front/hateoas/";
The script will find automatically the Data Array with prediction results based on the Data Product and plot the data using plotly library.
Notebook
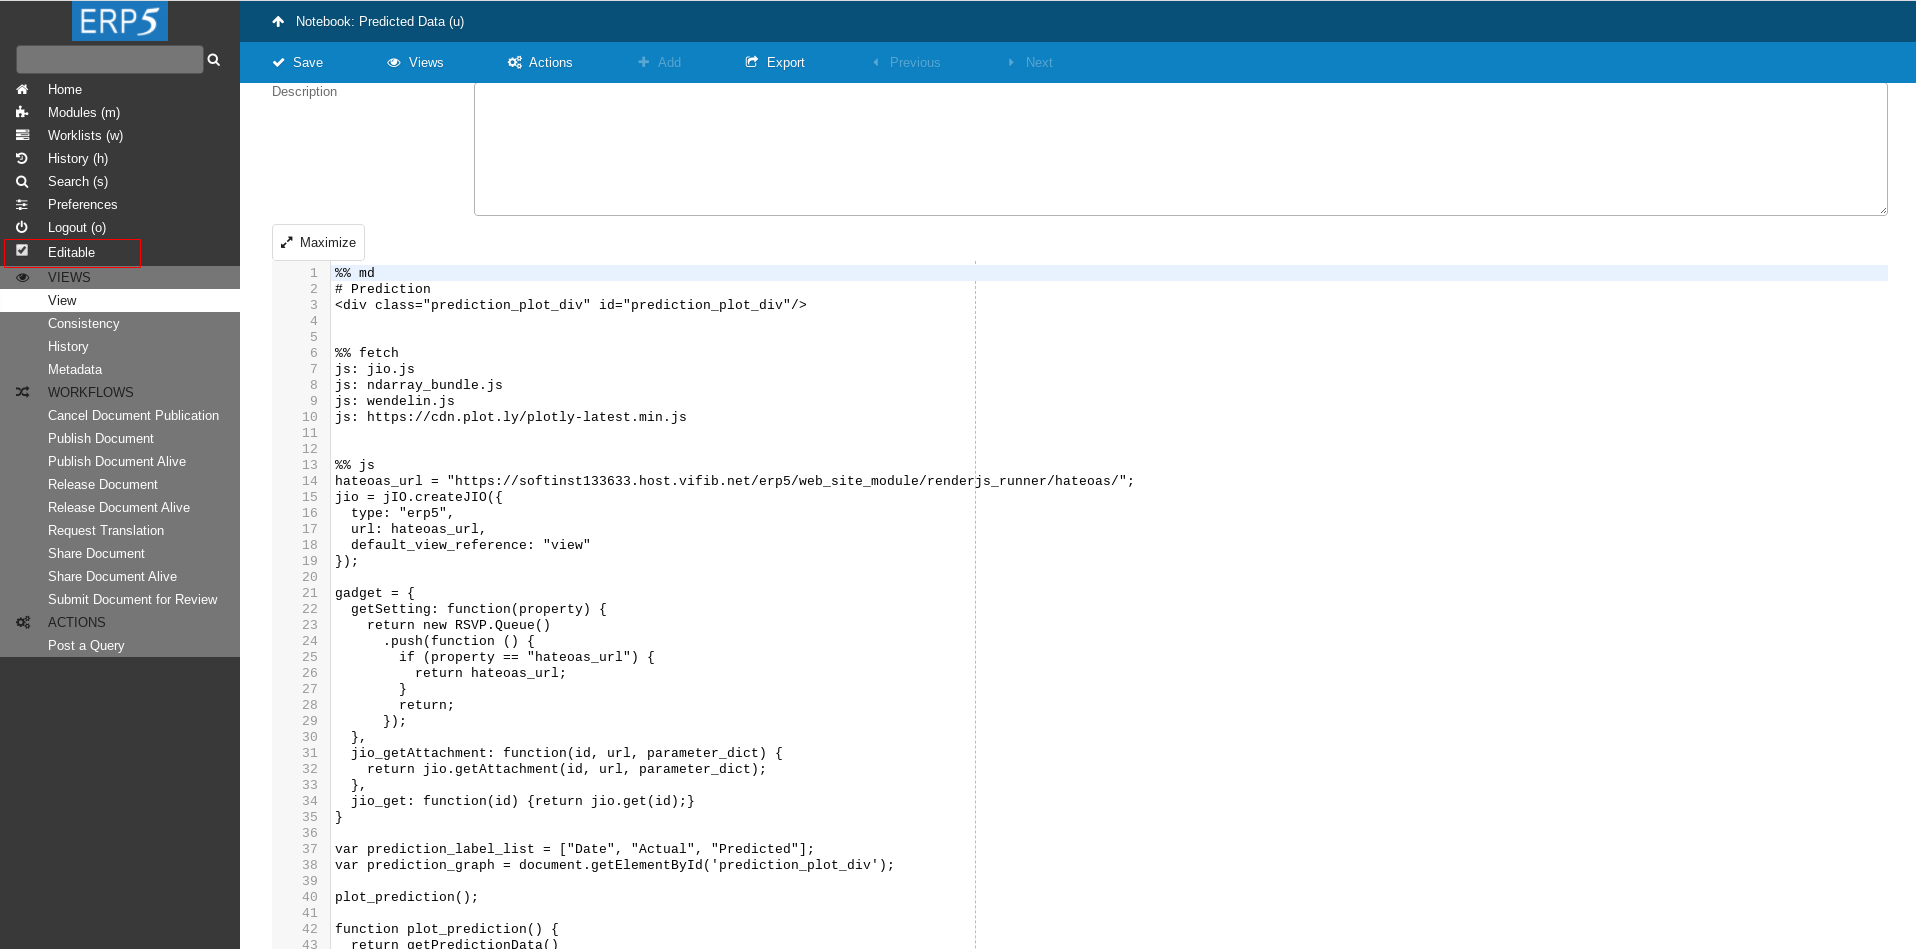
After writing the script and saving the changes click on the Editable checkbox to (uncheck it) on the left side panel to see the result.
Data Visualisation
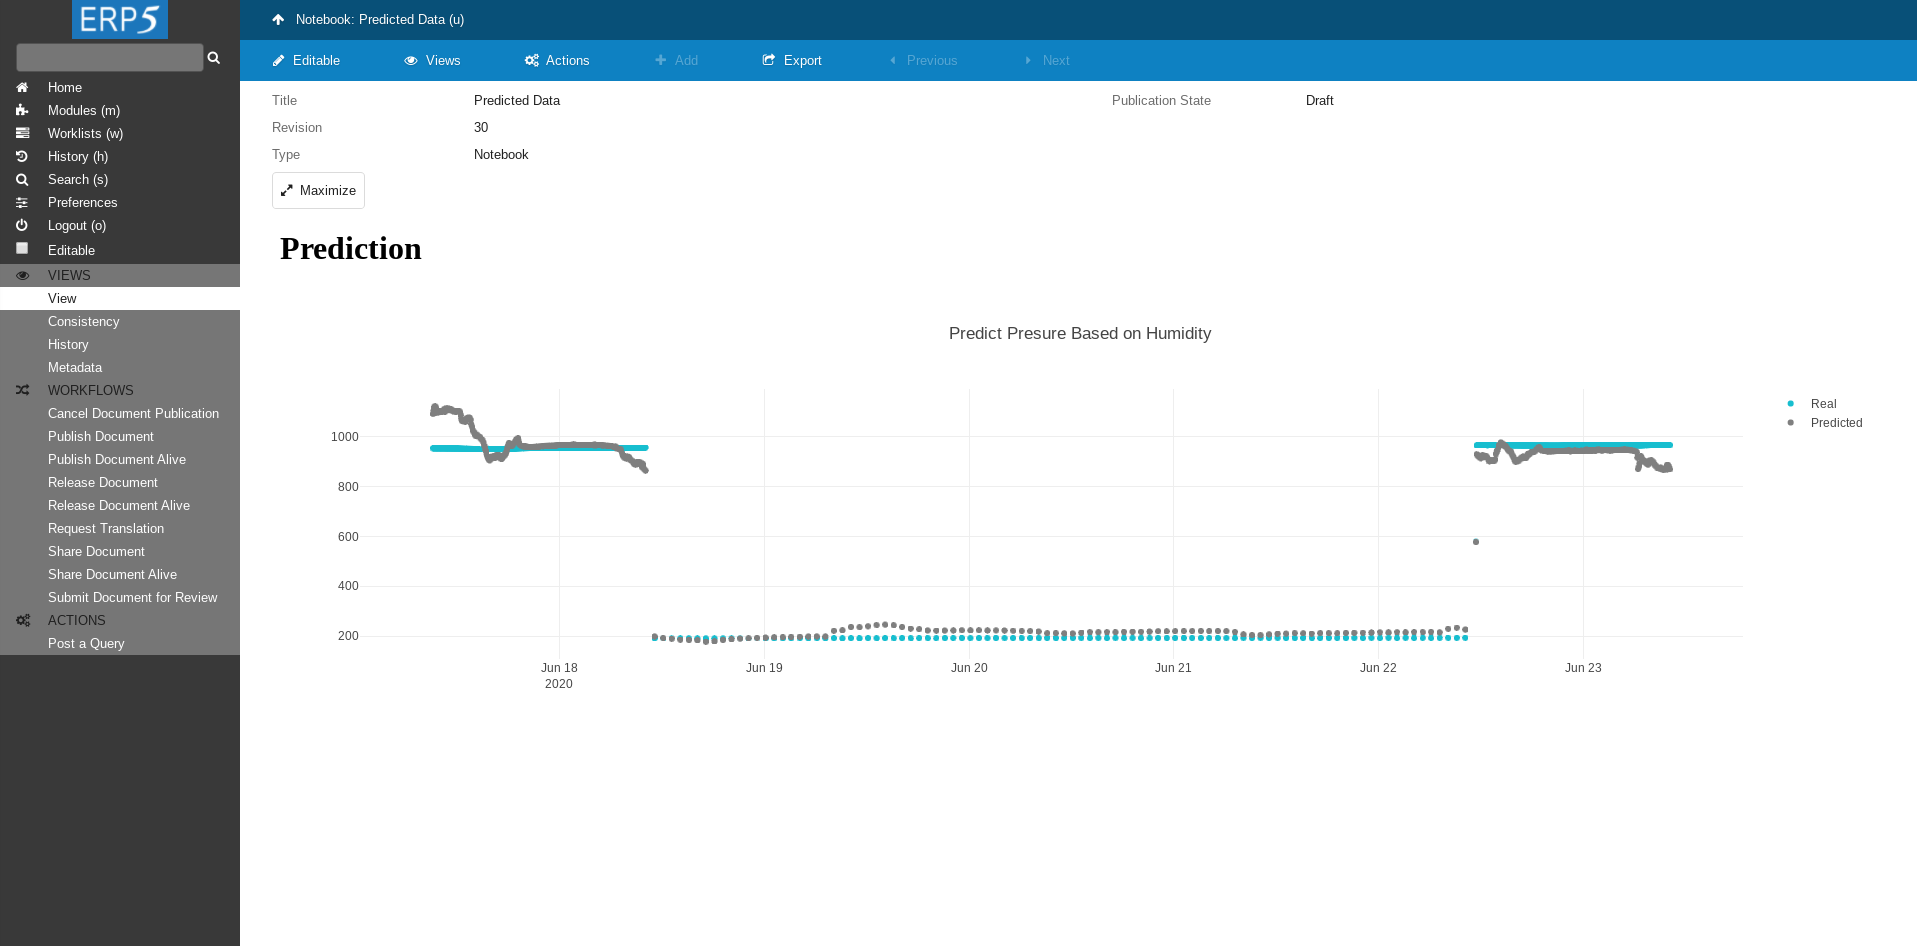
If everything was done correctly you will see the plot of your data.